Strategi perdagangan kuantitatif laba belum terealisasi relatif EMA100 dan NUPL

Ringkasan
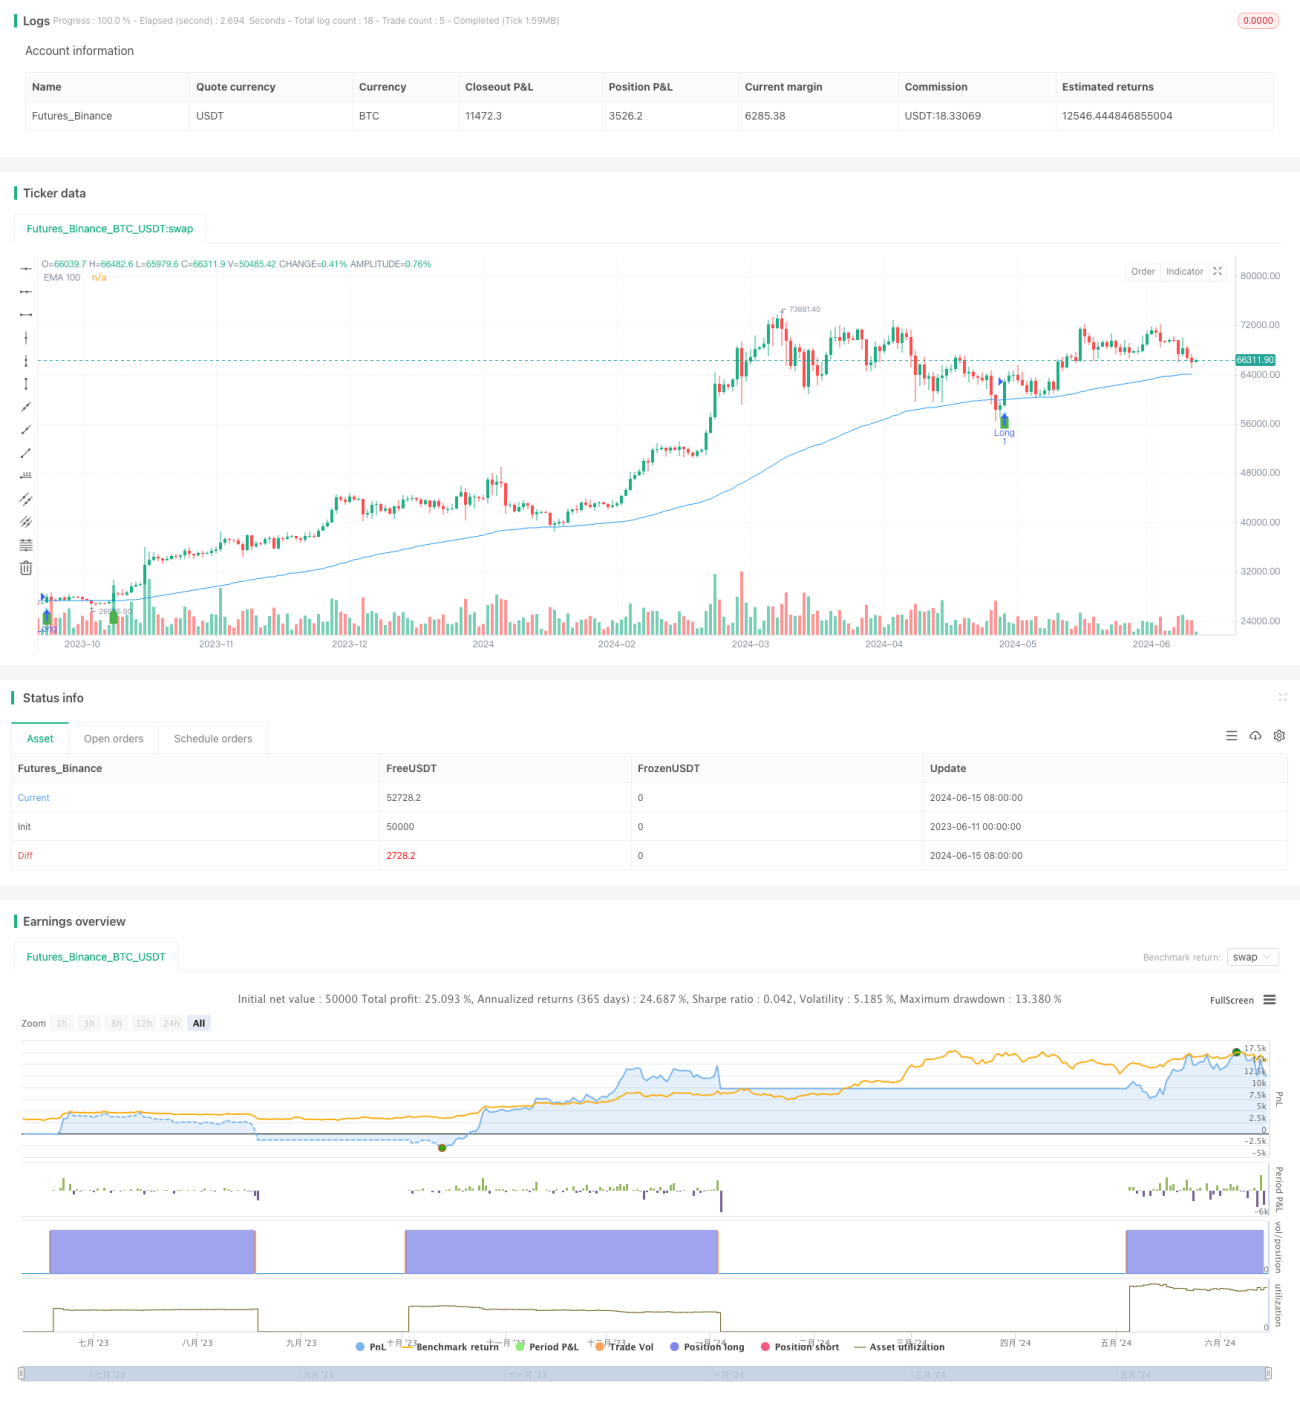
Strategi perdagangan ini didasarkan pada 100 siklus indeks moving average ((EMA100), net tidak terwujud keuntungan / kerugian ((NUPL) dan relatif tidak terwujud keuntungan tiga indikator, dengan menilai harga dengan EMA100 crossover dan NUPL dan relatif tidak terwujud keuntungan negatif untuk menghasilkan sinyal perdagangan. Bila harga melewati EMA100 dan NUPL dan relatif tidak terwujud keuntungan adalah positif, memicu sinyal multi; Bila harga melewati EMA100 dan NUPL dan relatif tidak terwujud keuntungan adalah negatif, memicu sinyal kosong. Strategi ini menggunakan 10% posisi tetap, dan menetapkan 10% stop loss.
Prinsip Strategi
- Perhitungan 100 siklus EMA sebagai indikator utama untuk menilai tren
- Menggunakan NUPL dan Relatif Unrealized Profits sebagai indikator tambahan untuk mengkonfirmasi kekuatan dan keberlanjutan tren
- Pada saat harga naik/turun melewati EMA100, NUPL dan relative unrealized profit pada saat yang sama menghasilkan sinyal over/under untuk saat positif/negatif
- Menggunakan 10% posisi tetap, dan mengatur 10% stop loss, mengendalikan risiko
- Ketika memegang posisi overhead, jika harga jatuh di atas harga stop loss, posisi overhead akan dihapus; ketika memegang posisi overhead, jika harga jatuh di atas harga stop loss, posisi overhead akan dihapus
Analisis Keunggulan
- Sederhana dan mudah dipahami: Strategi ini logis, menggunakan indikator teknis yang umum, mudah dipahami dan diterapkan
- Pelacakan tren: menangkap tren utama melalui EMA100, cocok untuk digunakan di pasar tren
- Pengendalian risiko: pengaturan posisi tetap dan stop loss, yang dapat mengontrol risiko secara efektif
- Adaptabilitas: Strategi ini dapat diterapkan di berbagai pasar dan indeks perdagangan
Analisis risiko
- False Signal: Dalam pasar yang bergoyang, harga yang sering berselisih dengan EMA100 dapat menghasilkan lebih banyak sinyal palsu yang menyebabkan kerugian
- Keterlambatan: EMA sebagai indikator keterlambatan, mungkin bereaksi lambat pada saat perubahan tren, kehilangan waktu masuk yang optimal
- Optimasi parameter: parameter strategi (seperti siklus EMA, ukuran posisi, stop loss ratio) perlu dioptimalkan sesuai dengan pasar yang berbeda, parameter yang tidak tepat dapat menyebabkan efektivitas strategi yang buruk
Arah optimasi
- Optimasi parameter: mengoptimalkan parameter seperti siklus EMA, ukuran posisi, dan stop loss ratio untuk meningkatkan kinerja strategi
- Sinyal filter: menambahkan indikator teknis lainnya atau indikator sentimen pasar, memfilter sinyal palsu
- Manajemen posisi dinamis: posisi yang disesuaikan secara dinamis dengan faktor-faktor seperti volatilitas pasar, keuntungan dan kerugian akun, meningkatkan keuntungan dan mengendalikan risiko
- Portfolio multi-head: memegang posisi multi-head dan kosong sekaligus, melindungi risiko pasar, meningkatkan stabilitas strategi
Meringkaskan
Strategi perdagangan ini menghasilkan sinyal perdagangan melalui tiga indikator EMA100, NUPL dan keuntungan yang relatif tidak tercapai, dengan keunggulan seperti kejelasan logika, kontrol risiko, dan adaptasi yang kuat. Namun, ada juga risiko seperti sinyal palsu, keterbelakangan, dan optimasi parameter. Strategi dapat dioptimalkan dan ditingkatkan di masa depan melalui optimasi parameter, pemfilteran sinyal, manajemen posisi dinamis, dan kombinasi multi-kamar.
- 1