Strategi perdagangan stop loss dinamis EMA

Ringkasan
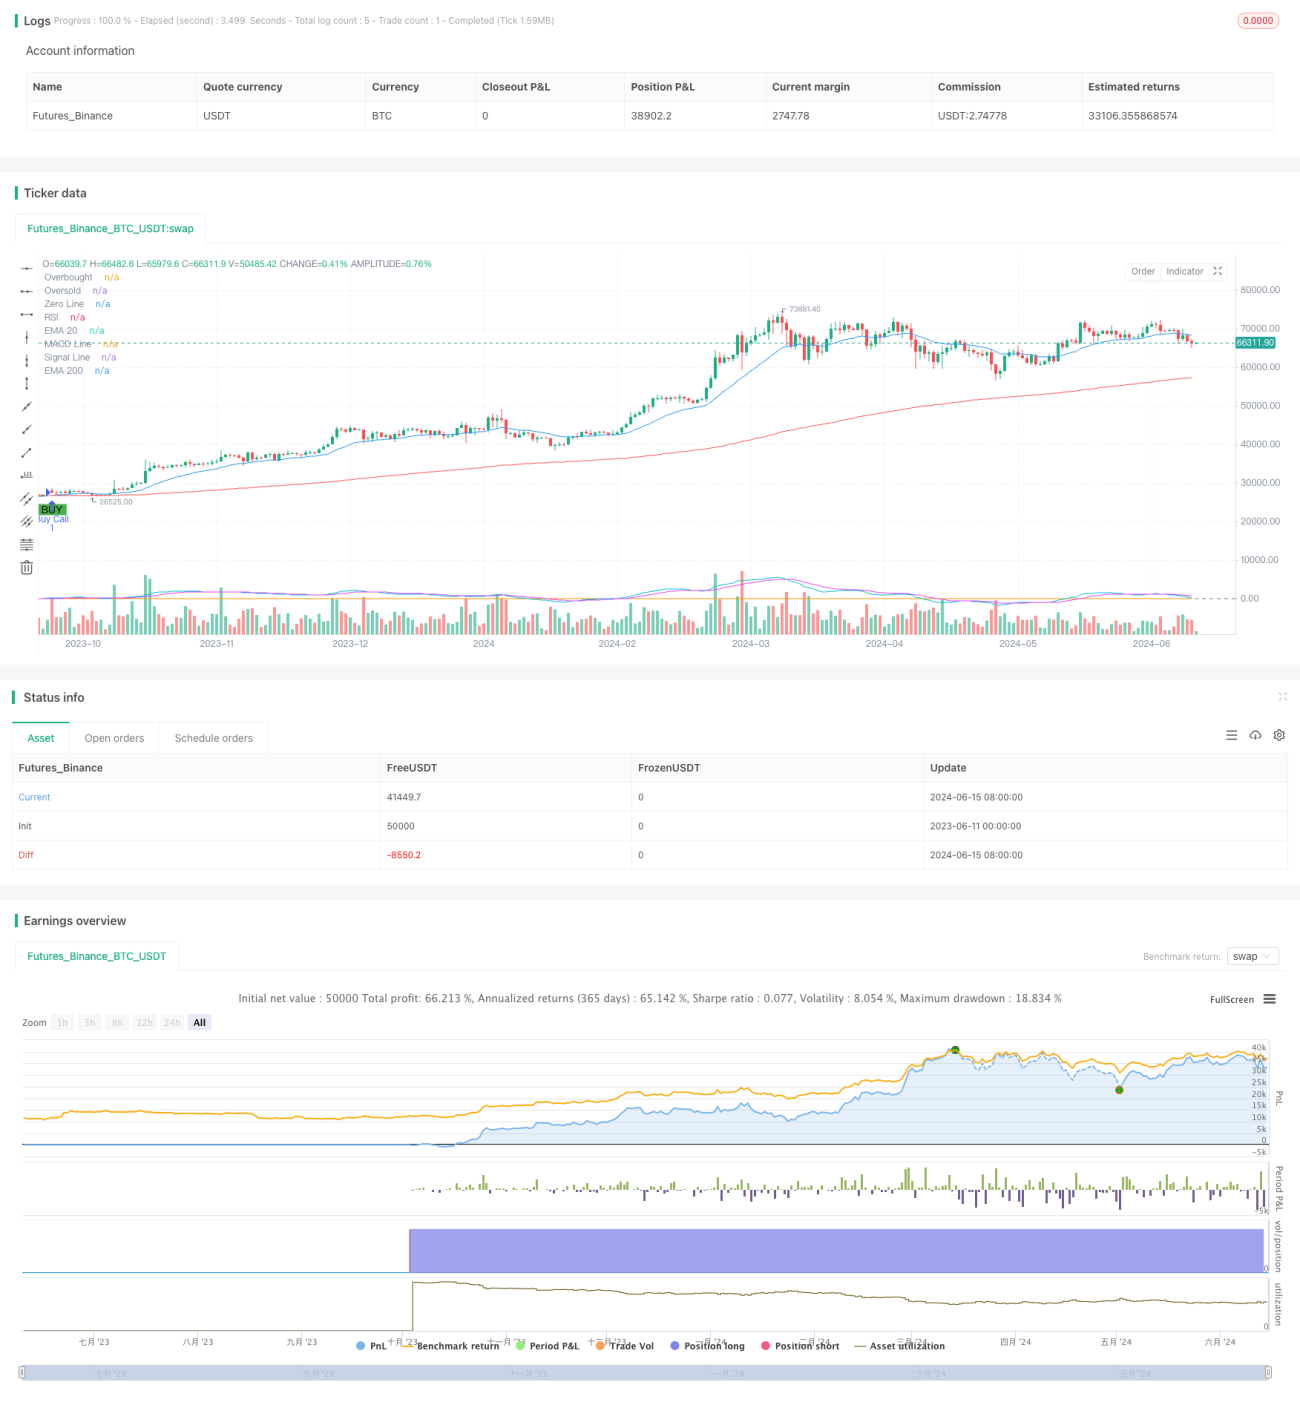
Strategi ini didasarkan pada sinyal silang 20 dan 200 hari indeks moving averages (EMA) dan digabungkan dengan indikator relatif kuat (RSI) dan indikator pergerakan rata-rata bertepatan dengan dispersi (MACD) untuk mengkonfirmasi untuk menghasilkan sinyal beli dan jual. Pada saat yang sama, strategi ini menggunakan metode stop loss dinamis dan target pendapatan tetap untuk mengelola risiko perdagangan dan mengunci keuntungan.
Prinsip Strategi
- Perhitungan 20 dan 200 hari EMA, ketika 20 hari EMA di atas melewati 200 hari EMA, menghasilkan sinyal beli; ketika 20 hari EMA di bawah melewati 200 hari EMA, menghasilkan sinyal jual.
- Menggunakan RSI dan MACD untuk mengkonfirmasi sinyal silang EMA, hanya melakukan pembelian ketika RSI lebih tinggi dari 50 dan garis MACD lebih tinggi dari garis sinyal; hanya melakukan penjualan ketika RSI lebih rendah dari 50 dan garis MACD lebih rendah dari garis sinyal.
- Tetapkan target tingkat keuntungan tetap (misalnya 20%) dan stop loss awal (misalnya 10%).
- Ketika keuntungan memegang posisi mencapai target tingkat keuntungan, meningkatkan harga stop loss ke bawah 10% dari harga saat ini, untuk mencapai stop loss dinamis.
- Ketika harga menyentuh harga stop loss dinamis, posisi terdepan berakhir dengan keuntungan.
Keunggulan Strategis
- Kombinasi beberapa indikator teknis untuk mengkonfirmasi sinyal transaksi, meningkatkan keandalan sinyal.
- Menggunakan metode stop loss yang dinamis, sementara mengunci keuntungan, memberikan ruang untuk harga untuk mundur, menghindari posisi terlambat.
- Menetapkan target tingkat pengembalian yang tetap membantu mengendalikan risiko dan mencapai keuntungan yang stabil.
Risiko Strategis
- Sinyal silang EMA dapat terjadi dengan seringnya sinyal palsu, yang menyebabkan peningkatan biaya perdagangan.
- Dalam pasar yang bergolak, strategi ini dapat menyebabkan kerugian beruntun.
- Target fixed yield dan stop loss mungkin tidak sesuai dengan kondisi pasar yang berbeda dan perlu disesuaikan dengan volatilitas pasar.
Arah optimasi strategi
- Masukkan lebih banyak indikator teknis atau indikator sentimen pasar untuk meningkatkan akurasi dan keandalan sinyal.
- Menggunakan target tingkat keuntungan dan stop loss yang disesuaikan, menyesuaikan secara dinamis sesuai dengan volatilitas pasar dan karakteristik aset.
- Menggabungkan tren pasar dan siklus fluktuasi, menggunakan pengaturan parameter yang berbeda dalam lingkungan pasar yang berbeda.
Meringkaskan
Strategi ini memiliki prospek untuk mendapatkan keuntungan yang stabil di pasar yang sedang tren, melalui EMA cross signal yang dikombinasikan dengan RSI dan MACD konfirmasi, serta metode manajemen risiko stop loss dinamis dan target pendapatan tetap. Namun, dalam pasar yang bergoyang, strategi ini mungkin menghadapi risiko perdagangan yang sering dan kerugian berturut-turut. Oleh karena itu, perlu lebih banyak pengoptimalan dan perbaikan untuk meningkatkan kemampuan adaptasi dan ketahanan strategi.
- 1