Strategi perdagangan kuantitatif yang menggabungkan EMA dan tren super

Ringkasan
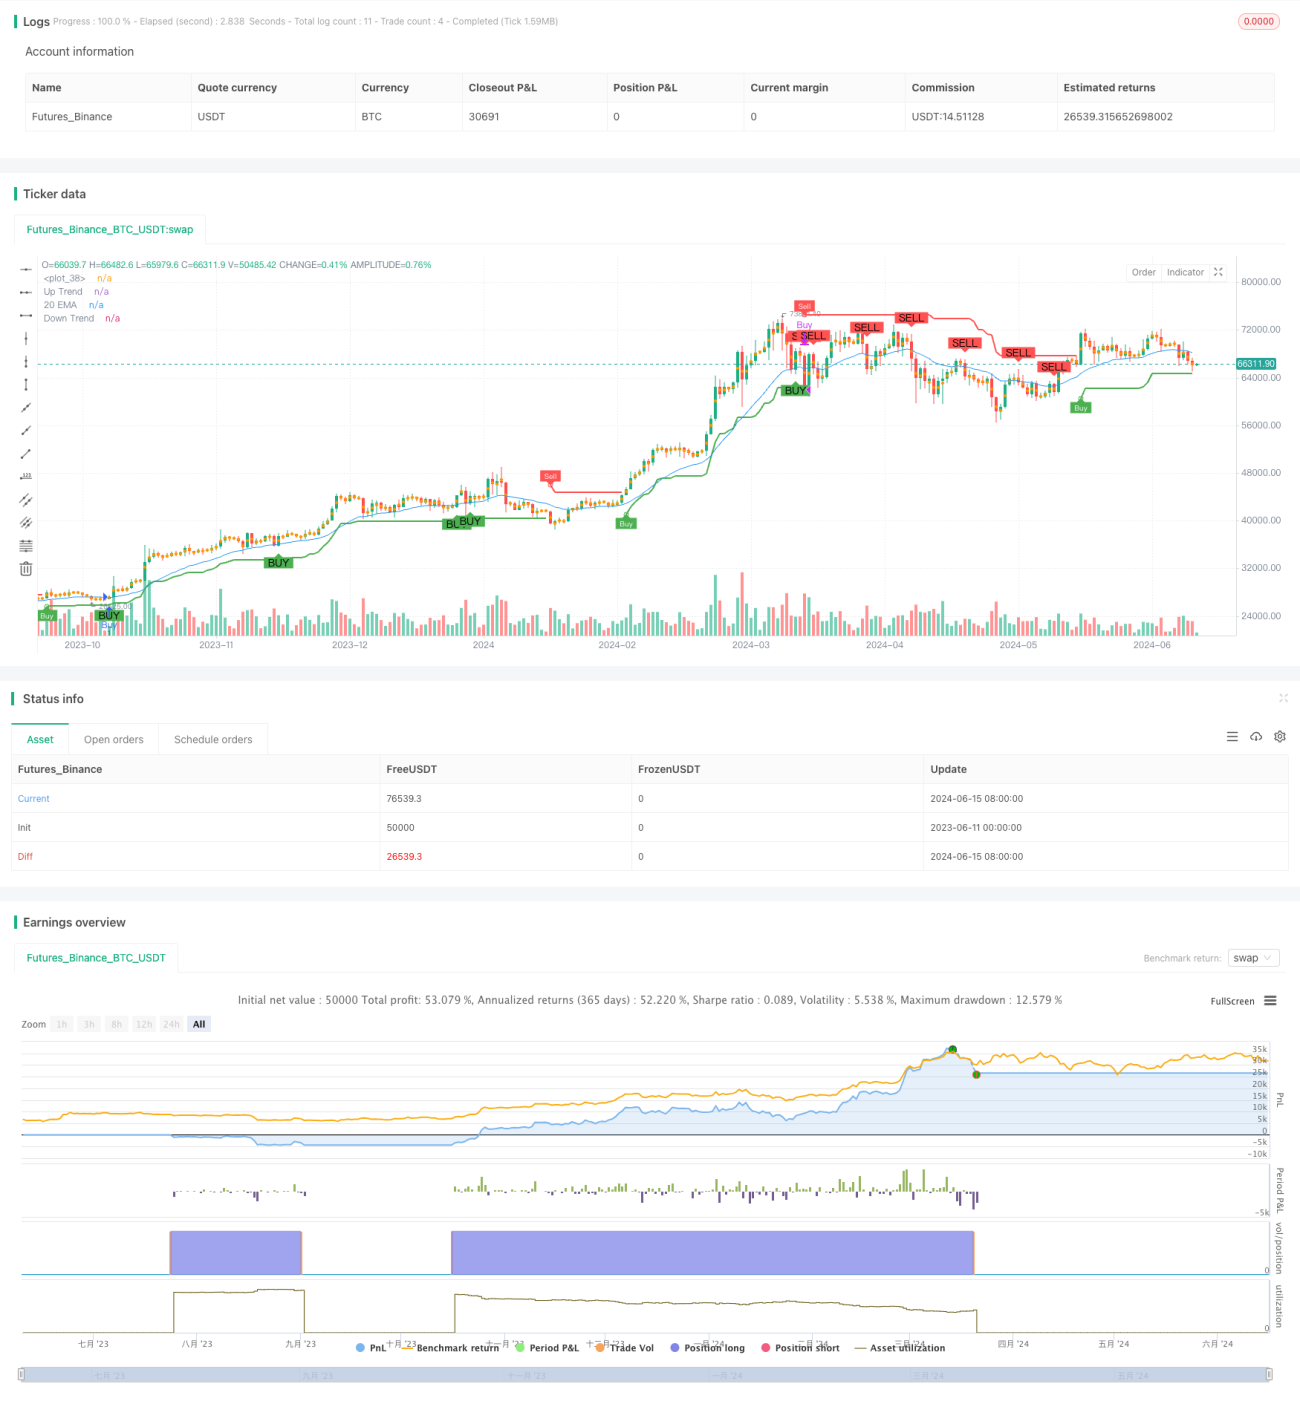
Strategi ini menggabungkan indeks moving average (EMA) dan indikator supertrend (Supertrend) untuk menghasilkan sinyal jual beli. Sebuah sinyal beli dihasilkan ketika harga dari atas menembus 20 hari EMA dan indikator supertrend berada dalam tren bullish. Sebuah sinyal jual dihasilkan ketika harga dari bawah menembus 20 hari EMA dan indikator supertrend berada dalam tren bullish.
Prinsip Strategi
- Perhitungan 20 hari EMA sebagai kondisi penyaringan untuk penilaian tren.
- Menghitung indikator supertrend, yang memetakan naik turun berdasarkan rentang rata-rata nyata (ATR) dan tren multi-area.
- Sinyal jual beli dihasilkan berdasarkan arah tren dari indikator supertrend dan posisi harga terhadap 20 EMA:
- Sebuah sinyal beli dihasilkan ketika harga menembus 20 hari EMA dari atas dan indikator supertrend berada dalam tren bullish.
- Sinyal jual dihasilkan ketika harga turun dari bawah 20 hari EMA dan indikator supertrend berada dalam tren turun.
- Strategi: buka posisi lebih besar berdasarkan sinyal beli, tutup posisi lebih kecil berdasarkan sinyal jual.
Keunggulan Strategis
- Kombinasi EMA dan indikator supertrend dapat secara efektif menangkap tren dan mengurangi sinyal palsu.
- Indikator supertrend didasarkan pada ATR, yang dapat secara dinamis menyesuaikan jarak naik turun untuk menyesuaikan dengan fluktuasi pasar yang berbeda.
- EMA berfungsi sebagai penyaring untuk menilai tren, yang dapat memastikan bahwa posisi dibuka di arah tren dan meningkatkan peluang strategi untuk menang.
- Strategi logisnya sederhana, mudah dipahami dan diterapkan.
Risiko Strategis
- Dalam pasar yang bergejolak, strategi ini dapat sering menghasilkan sinyal beli dan jual, yang menyebabkan terlalu banyak transaksi dan kehilangan biaya.
- Strategi ini bergantung pada indikator EMA dan supertrend, yang dapat gagal atau terlambat dalam kondisi pasar tertentu.
- Strategi ini tidak mempertimbangkan manajemen risiko, seperti manajemen stop loss dan posisi, yang dapat menyebabkan penarikan yang lebih besar saat pasar bergejolak.
Arah optimasi strategi
- Menambahkan mekanisme stop loss, seperti stop loss dinamis berdasarkan ATR, untuk mengontrol kerugian maksimum dalam satu transaksi.
- Mengoptimalkan parameter EMA dan indikator supertrend, seperti menggunakan metode optimasi parameter untuk menemukan kombinasi parameter yang optimal, meningkatkan adaptasi dan stabilitas strategi.
- Memperkenalkan manajemen posisi, menyesuaikan ukuran posisi secara dinamis sesuai dengan volatilitas pasar atau kerugian akun, untuk mengendalikan risiko keseluruhan.
- Pertimbangkan untuk menambahkan kondisi penyaringan lainnya, seperti volume transaksi, volatilitas, dan lain-lain, untuk mengurangi sinyal palsu lebih lanjut.
Meringkaskan
Strategi ini menghasilkan sinyal jual beli dengan menggabungkan EMA 20 hari dan indikator supertrend, yang bertujuan untuk menangkap perilaku yang cenderung cenderung. Keunggulan strategi ini adalah logika yang sederhana, kombinasi EMA dan indikator supertrend dapat secara efektif mengurangi sinyal palsu. Namun, dalam pasar yang bergolak, strategi ini mungkin sering diperdagangkan dan tidak ada tindakan manajemen risiko.
- 1