Strategi Crossover EMA Lanjutan: Sistem Perdagangan Adaptif Berdasarkan Stop Loss Dinamis dan Target Keuntungan

Ringkasan
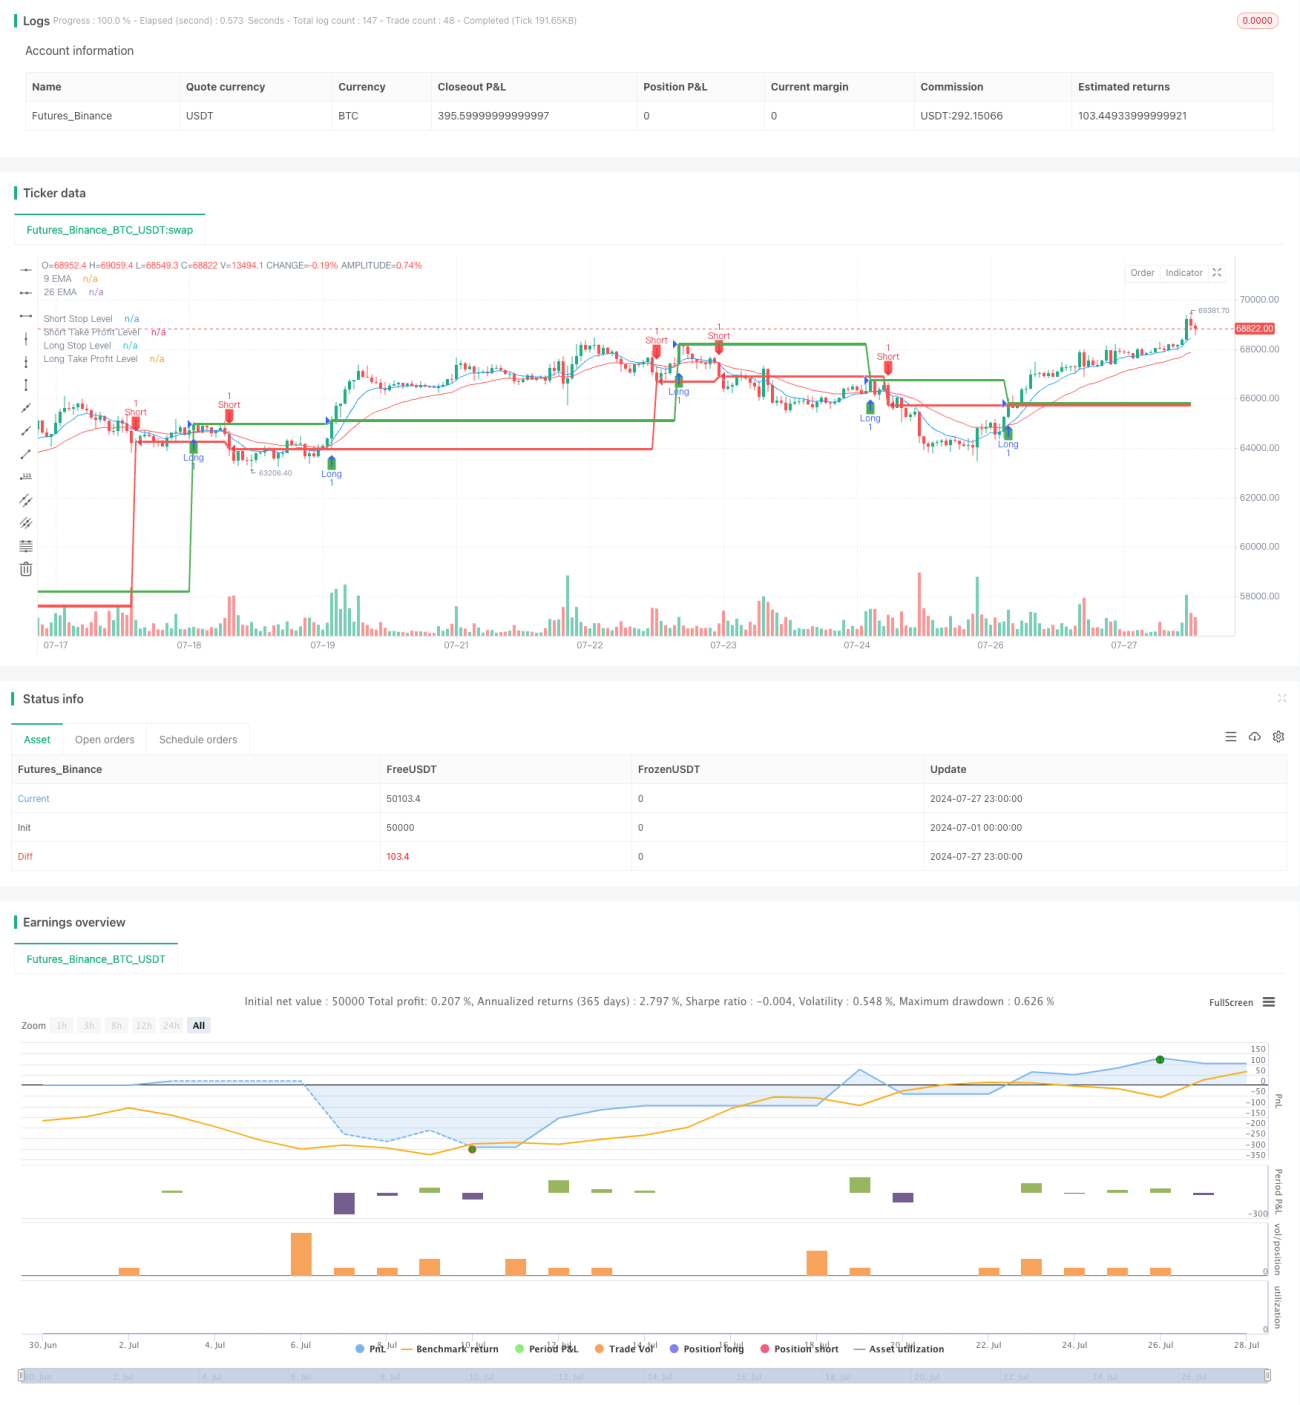
Strategi EMA Advanced Crossing adalah sistem perdagangan yang beradaptasi sendiri yang menggunakan crossing of moving averages (EMA) untuk menghasilkan sinyal perdagangan. Strategi ini menggabungkan 9 siklus dan 26 siklus EMA, yang memicu sinyal beli dan jual saat mereka bersilang. Strategi ini unik karena memperkenalkan stop loss dan profit target yang tetap untuk mengelola risiko dan mengunci keuntungan.
Prinsip Strategi
Inti dari strategi ini adalah menggunakan persilangan dua EMA untuk menilai tren pasar.
- Menggunakan 9 siklus dan 26 siklus EMA sebagai indikator utama.
- Ketika 9 EMA melewati 26 EMA dari bawah, memicu sinyal beli.
- Ketika 9 EMA dari atas melewati 26 EMA, pemicu akan mengeluarkan sinyal sell.
- Setiap transaksi memiliki target stop loss dan profit yang ditetapkan, yang dihitung sebagai tick.
- Stop loss untuk pembelian ditetapkan 90 tick di bawah harga masuk, dan target keuntungan ditetapkan 270 tick di atas harga masuk.
- Stop loss untuk menjual setelan 90 tick di atas harga masuk, dan target profit setelan 270 tick di bawah harga masuk.
- Garis EMA, sinyal perdagangan, level stop loss dan profit di gambar untuk analisis intuitif.
- Siapkan fungsi peringatan untuk memberi tahu pedagang ketika terjadi persilangan EMA.
Keunggulan Strategis
- Pelacakan tren: Menggunakan EMA untuk menangkap tren pasar yang dapat membantu Anda melakukan perdagangan berlawanan arah.
- Manajemen risiko: Tujuan stop loss dan profit yang tetap membantu mengendalikan risiko dan potensi keuntungan dari setiap perdagangan.
- Visualisasi: menampilkan berbagai sinyal dan tingkat harga kunci dengan jelas pada grafik untuk memudahkan analisis dan pengambilan keputusan.
- Otomatisasi: Strategi dapat mengeksekusi transaksi secara otomatis, mengurangi intervensi manusia dan pengaruh emosional.
- Fleksibilitas: Parameter EMA dan pengaturan stop loss / profit dapat disesuaikan sesuai dengan pasar dan kerangka waktu yang berbeda.
- Real-time Alert: Membantu trader untuk menangkap peluang pasar tepat waktu dan meningkatkan kecepatan reaksi.
Risiko Strategis
- Overtrading: Dalam pasar yang bergejolak, EMA dapat sering berselisih, menyebabkan terlalu banyak sinyal palsu.
- Lagging: EMA pada dasarnya merupakan indikator lagging, dan mungkin bereaksi lambat ketika tren berbalik.
- Stop loss / profit yang tetap: Dalam pasar yang lebih berfluktuasi, stop loss yang tetap mungkin terlalu kecil, dan target profit mungkin terlalu besar.
- Kurangnya identifikasi lingkungan pasar: strategi tidak mempertimbangkan lingkungan pasar secara keseluruhan, dan mungkin berdagang dalam kondisi pasar yang tidak sesuai.
- Ketergantungan pada satu indikator: hanya mengandalkan EMA cross mungkin mengabaikan informasi pasar penting lainnya.
Arah optimasi strategi
- Tujuan stop loss dan profit yang dinamis: Pertimbangkan untuk menggunakan ATR (Average True Range) untuk secara dinamis menyesuaikan level stop loss dan profit agar sesuai dengan volatilitas pasar.
- Menambahkan kondisi penyaringan: memperkenalkan indikator teknis lainnya (seperti RSI atau MACD) sebagai sinyal konfirmasi, mengurangi false breakout.
- Identifikasi lingkungan pasar: Tambahkan indikator kekuatan tren (seperti ADX), dan lakukan perdagangan hanya di pasar tren yang kuat.
- Analisis multi-frame waktu: Menggabungkan jangka waktu yang lebih panjang untuk mengkonfirmasi arah tren secara keseluruhan.
- Manajemen Posisi: Mengimplementasikan fungsi stop-loss dan deposit untuk mengoptimalkan manajemen dana.
- Pemantauan dan optimasi: Pemantauan menyeluruh terhadap kombinasi parameter yang berbeda untuk menemukan pengaturan optimal.
- Meningkatkan filter volume transaksi: Menghindari transaksi pada periode volume transaksi rendah, mengurangi risiko slippage dan false breakout.
Meringkaskan
Strategi EMA Advanced Crossover ini memberikan kerangka kerja yang sederhana dan efektif untuk menangkap tren pasar dan mengelola risiko. Dengan menggabungkan sinyal EMA Crossover, parameter manajemen risiko tetap, dan peringatan real-time, strategi ini menyediakan pedagang dengan sistem perdagangan yang komprehensif. Namun, untuk hasil yang lebih baik dalam perdagangan nyata, disarankan untuk melakukan pengoptimalan dan pengujian lebih lanjut.
- 1