
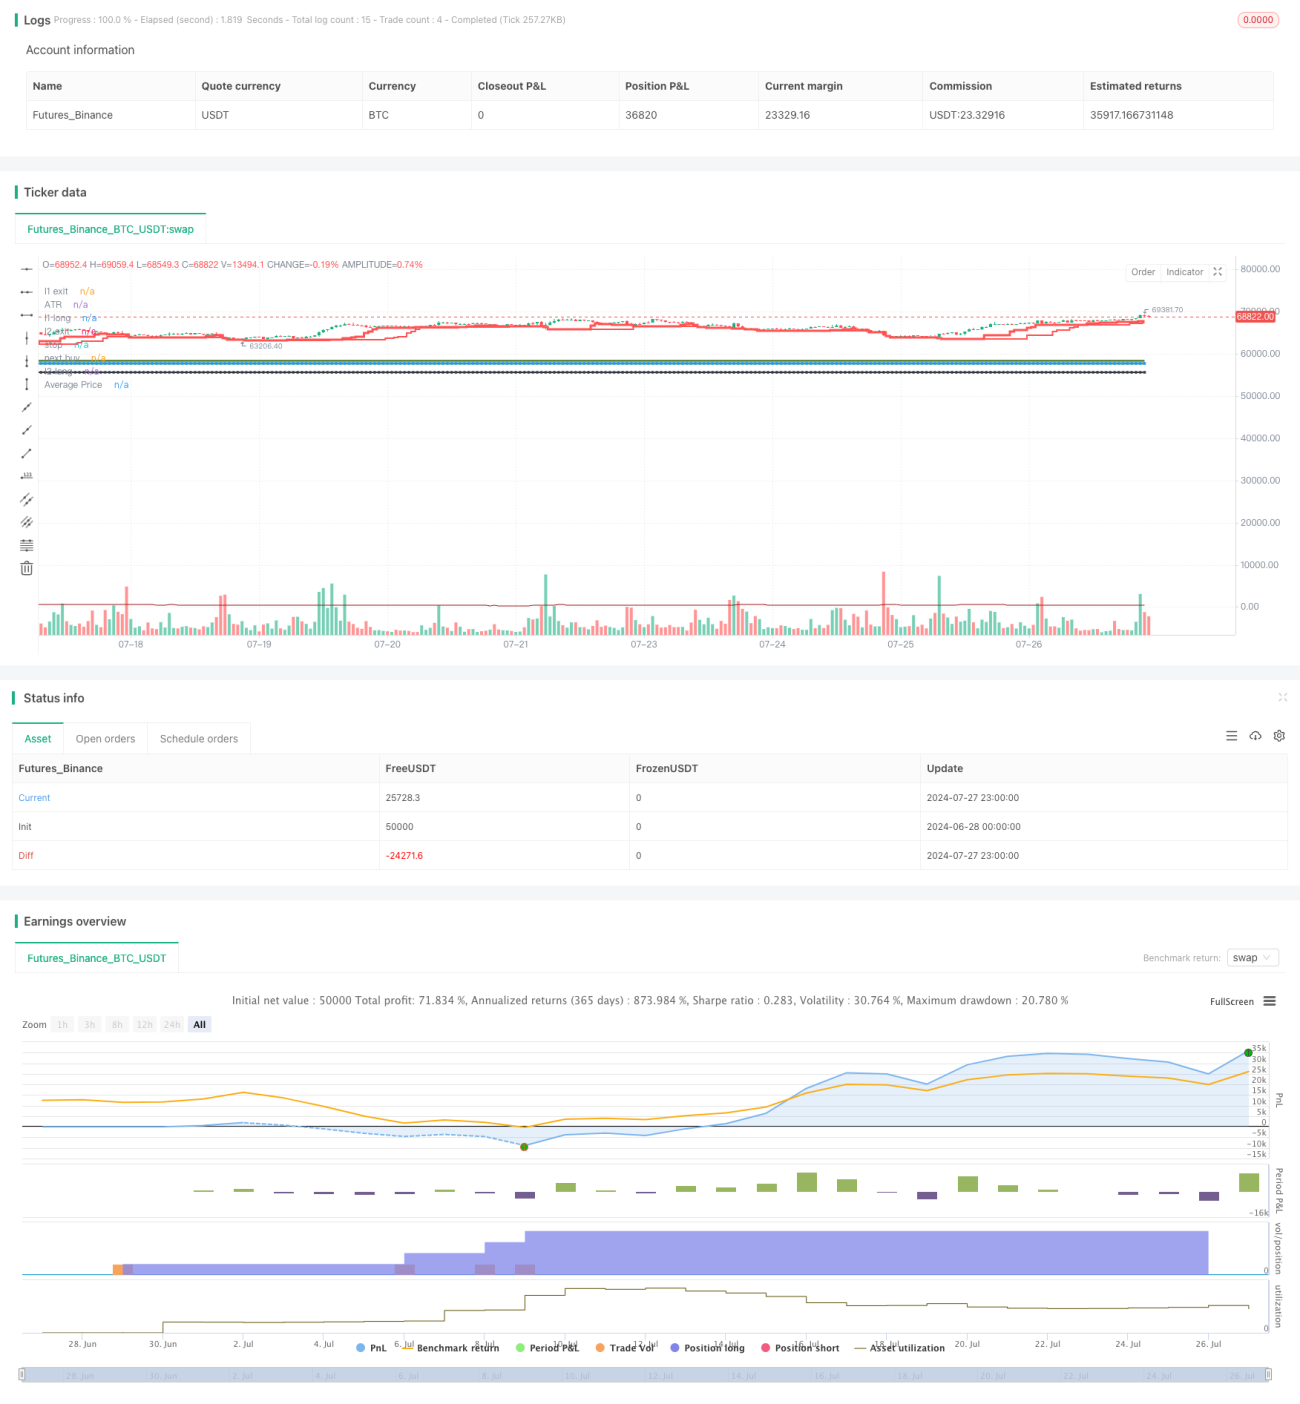
Sistem pelacakan tren dinamis bertingkat adalah strategi perbaikan yang didasarkan pada aturan perdagangan pirus. Strategi ini memanfaatkan sinyal tren dari beberapa periode waktu, menggabungkan stop loss dinamis dan kenaikan posisi piramida, untuk mendapatkan kendali atas tren jangka menengah dan panjang. Sistem ini menangkap tren dengan kecepatan yang berbeda dengan mengatur dua siklus pelacakan tren (L1 dan L2) dan menggunakan indikator ATR yang disesuaikan untuk secara dinamis menyesuaikan posisi masuk, kenaikan posisi dan penurunan posisi.
Pengidentifikasian tren: Menggunakan dua periode rata-rata bergerak (L1 dan L2) untuk mengidentifikasi tren dengan kecepatan yang berbeda. L1 digunakan untuk menangkap tren yang lebih cepat, L2 digunakan untuk menangkap tren yang lebih lambat tetapi lebih andal.
Sinyal masuk: Membuat sinyal lebih banyak ketika harga melampaui titik tertinggi L1 atau L2. Jika perdagangan L1 terakhir menguntungkan, melompati sinyal L1 berikutnya sampai sinyal L2 muncul.
Stop loss dinamis: menggunakan kelipatan ATR (default 3x) sebagai jarak stop loss awal, stop loss akan bergeser ke atas seiring bertambahnya waktu memegang posisi.
Peningkatan posisi piramida: setiap kali harga naik 0,5 ATR dalam perpanjangan tren, kenaikan posisi dilakukan hingga 5 kali.
Pengendalian risiko: risiko setiap transaksi tidak lebih dari 2% dari nilai bersih akun, dengan cara menghitung jumlah kepemilikan secara dinamis.
Mekanisme Keluar: Penutupan posisi ketika harga turun ke 10th low (L1) atau 20th low (L2), atau penutupan posisi saat triggering Moving Stop Lines
Tangkapan tren multi-tingkat: Dengan dua siklus L1 dan L2, dapat menangkap tren cepat, dan dapat menangkap tren jangka panjang, meningkatkan fleksibilitas dan stabilitas strategi.
Manajemen risiko dinamis: Menggunakan ATR sebagai indikator volatilitas, dimungkinkan untuk menyesuaikan posisi entry, stop loss, dan overlay secara dinamis, agar lebih beradaptasi dengan perubahan pasar.
Peningkatan posisi piramida: Peningkatan posisi secara bertahap selama tren berlanjut, untuk mengendalikan risiko dan memaksimalkan potensi keuntungan.
Fleksibilitas pengaturan parameter: Berbagai parameter yang dapat disesuaikan memungkinkan strategi untuk beradaptasi dengan berbagai pasar dan gaya perdagangan.
Otomatisasi pelaksanaan: Strategi dapat dijalankan secara otomatis dengan mengurangi intervensi manusia dan pengaruh emosional.
Risiko trend reversal: Berkinerja baik di pasar tren yang kuat, tetapi dalam pasar yang bergolak mungkin sering diperdagangkan menyebabkan kerugian.
Slip point dan biaya transaksi: Sering melakukan penambahan dan pergerakan stop loss dapat menyebabkan biaya transaksi yang lebih tinggi.
Risiko over-optimisasi: Banyak parameter yang dapat menyebabkan over-fit dengan data historis.
Manajemen risiko: Jika modal awal yang kecil, mungkin tidak dapat secara efektif melakukan beberapa kali peningkatan.
Risiko likuiditas pasar: Di pasar yang kurang likuid, mungkin sulit untuk melakukan transaksi sesuai dengan harga yang ideal.
Memperkenalkan filter kondisi pasar: Anda dapat menambahkan indikator kekuatan tren (seperti ADX) untuk menilai kondisi pasar, mengurangi frekuensi perdagangan di pasar yang bergoyang.
Optimalkan strategi uptrend: Anda dapat mempertimbangkan untuk menyesuaikan interval dan frekuensi uptrend secara dinamis sesuai dengan intensitas tren, bukan dengan 0.5 ATR dan 5 kali.
Memperkenalkan mekanisme stop-loss: Dalam tren jangka panjang, stop-loss parsial dapat diatur untuk mengunci keuntungan, seperti menutup setengah posisi ketika mencapai 3 kali lipat keuntungan ATR.
Analisis korelasi antar varietas: Analisis korelasi antar varietas dapat ditambahkan untuk mengoptimalkan rasio manfaat risiko keseluruhan ketika digunakan dalam kombinasi.
Tambahkan filter volatilitas: Anda dapat menangguhkan perdagangan atau menyesuaikan parameter risiko untuk menghadapi pasar yang tidak biasa pada periode volatilitas yang sangat tinggi.
Mengoptimalkan mekanisme keluar: Anda dapat mempertimbangkan untuk menggunakan indikator keluar yang lebih fleksibel, seperti parabolic SAR atau Chandelier Exit.
Sistem mengikuti tren dinamis multi-tingkat adalah strategi komprehensif yang menggabungkan aturan perdagangan tradisional dan teknologi kuantitatif modern. Dengan metode seperti identifikasi tren multi-tingkat, manajemen risiko dinamis, dan penambahan posisi piramida, strategi ini meningkatkan kemampuan untuk menangkap tren dan potensi keuntungan sambil tetap stabil. Meskipun menghadapi tantangan di pasar yang bergolak, strategi ini diharapkan untuk mempertahankan kinerja yang stabil di berbagai lingkungan pasar dengan pengoptimalan parameter dan kontrol risiko yang masuk akal.
/*backtest
start: 2024-06-28 00:00:00
end: 2024-07-28 00:00:00
period: 1h
basePeriod: 15m
exchanges: [{"eid":"Futures_Binance","currency":"BTC_USDT"}]
*/
//@version=5
// This is a strategy based on the famous turtle system.
// https://www.tradingblox.com/originalturtles/originalturtlerules.htm
//
// In a nutshell, it a trend trading system where you are buying on strength, selling on weakness.
// positions should be entered when the price crosses over the 20-day high (L1 high) or 55-day high (L2 high).
// positions should be exited when the prices crosses below the 10-day low (L1 low) or 20-day low (L2 low)
// you can add positions at every unit (measured by multiple of n, where n=1 ATR)
// stops should be placed at 2*n below every position entered, when the stop is hit exit your entire position.
// positions should be entered everytime price crosses over L1 or L2, with one exception:
// if the last trade was an L1 trade and it was a winning trade, skip the next trade unless the price crosses
// over L2, if that is the case, you should take it.
// L1 and L2 levels are also configurable for high and lows.
// N multiple for stops and pyramid are also configurable
// To change this from a strategy to a study:
// 1) uncomment the next line and comment out the strategy line.
// 2) at the end of the file comment out the last 2 lines
// study(title="Turtle Study", overlay=true)
strategy(title='kTF-VNI', overlay=true, initial_capital=100000000, commission_type=strategy.commission.percent, commission_value=0.0, pyramiding=100, process_orders_on_close=true, calc_on_every_tick=true)
stopInput = input.float(3, 'Stop N', step=.05)
riskPercent = input.float(.01, 'Risk % of capital', step=.005)
pyramidInput = input.float(0.5, 'Pyramid N', step=.05)
maxUnits = input.int(5, 'Max Pyramid Units', step=1)
atrPeriod = input(20, 'ATR period')
l1LongInput = 10
l2LongInput = 20
l1LongExitInput = 20
l2LongExitInput = 40
l1LongInput := input.int(20, 'L1 Long', minval=2)
l2LongInput := input.int(60, 'L2 Long', minval=2)
l1LongExitInput := input.int(10, 'L1 Long Exit', minval=2)
l2LongExitInput := input.int(20, 'L2 Long Exit', minval=2)
FromYear = input.int(1970, 'From Year', minval=1900)
FromMonth = input.int(1, 'From Month', minval=1, maxval=12)
FromDay = input.int(1, 'From Day', minval=1, maxval=31)
ToYear = input.int(9999, 'To Year', minval=1900)
ToMonth = input.int(1, 'To Month', minval=1, maxval=12)
ToDay = input.int(1, 'To Day', minval=1, maxval=31)
FromDate = timestamp(FromYear, FromMonth, FromDay, 00, 00)
ToDate = timestamp(ToYear, ToMonth, ToDay, 23, 59)
TradeDateIsAllowed() =>
time >= FromDate and time <= ToDate
l1Long = ta.highest(l1LongInput)
l1LongExit = ta.lowest(l1LongExitInput)
l2Long = ta.highest(l2LongInput)
l2LongExit = ta.lowest(l2LongExitInput)
bool win = false // tracks if last trade was winning trade of losing trade.
float buyPrice = 0.0 // tracks the buy price of the last long position.
float nextBuyPrice = 0.0 // tracks the next buy price
float stopPrice = na // tracks the stop price
int totalBuys = 0 // tracks the total # of pyramid buys
bool inBuy = false // tracks if we are in a long position or not.
float l1LongPlot = ta.highest(l1LongInput) // tracks the L1 price to display
float l2LongPlot = ta.highest(l2LongInput) // tracks the L2 price to display
float n = ta.atr(atrPeriod) // tracks the n used to calculate stops and pyramid buys
string mode = 'L1' // tracks whether we are in a L1 position or L2 position.
bool fake = na // tracks if this is a fake trade, see comments below.
string longLevel = na // tracks where long positions, stops, pyramid buys occur.
float capitalLeft = strategy.initial_capital
var shares = 0
float fakeBuyPrice = 0.0
// by default use the last value from the previous bar.
buyPrice := buyPrice[1]
totalBuys := totalBuys[1]
nextBuyPrice := nextBuyPrice[1]
stopPrice := stopPrice[1]
win := win[1]
capitalLeft := capitalLeft[1]
inBuy := inBuy[1]
n := ta.atr(atrPeriod)
fakeBuyPrice := fakeBuyPrice[1]
// State to track if we are in a long positon or not.
if not inBuy[1] and (high > l1Long[1] or high > l2Long[1])
inBuy := true
inBuy
else
inBuy := inBuy[1] and low < stopPrice[1] ? false : inBuy
inBuy := inBuy[1] and mode[1] == 'L1' and low < l1LongExit[1] ? false : inBuy
inBuy := inBuy[1] and mode[1] == 'L2' and low < l2LongExit[1] ? false : inBuy
inBuy
// State to track if we are ia a fake trade. If the last trade was a winning, we need to skip the next trade.
// We still track it though as a fake trade (not counted against us). as the outcome determines if we can
// can take the next trade.
if not inBuy[1] and high > l1Long[1] and win[1]
fake := true
fakeBuyPrice := close
fakeBuyPrice
else
fake := fake[1]
fake
if fake[1] and inBuy[1] and not inBuy
fake := false
win := close >= fakeBuyPrice
win
fake := high > l2Long[1] ? false : fake
// Series representing the l1 and l2 levels. If we break out above the l1 or l2 level, we want the
// line to stay at the breakout level, not follow it up.
l1LongPlot := not inBuy[1] or inBuy[1] and mode == 'L1' and fake[1] ? l1Long[1] : l1LongPlot[1]
l2LongPlot := not inBuy[1] or inBuy[1] and mode == 'L1' and fake[1] ? l2Long[1] : l2LongPlot[1]
// Variable in the series is only set when it happens. Possible values is L1, L2, SR
// (stopped out with a loss), SG (exited with a gain), and 'P' for pyramid buy.
longLevel := not inBuy[1] and high > l1Long[1] ? 'L1' : na
longLevel := (not inBuy[1] or inBuy[1] and fake[1]) and high > l2Long[1] ? 'L2' : longLevel
// Either 'L1' or 'L2' depending on what breakout level we are in.
mode := longLevel == na ? mode[1] : longLevel
// Variables to track calculating nextBuyPrice for pyramiding.
if longLevel == 'L1' or longLevel == 'L2'
buyPrice := close
totalBuys := 1
stopPrice := close - stopInput * n
nextBuyPrice := close + pyramidInput * n
nextBuyPrice
// Marks if we hit our next buy price, if so mark it with a 'P'
longLevel := longLevel == na and inBuy[1] and high > nextBuyPrice and TradeDateIsAllowed() and totalBuys < maxUnits ? 'P' : longLevel
if longLevel == 'P'
buyPrice := close
totalBuys := totalBuys[1] + 1
stopPrice := close - stopInput * n
nextBuyPrice := close + pyramidInput * n
nextBuyPrice
// Tracks stops and exits, marking them with SG or SR
longLevel := longLevel == na and inBuy[1] and low < stopPrice and close >= strategy.position_avg_price ? 'SG' : longLevel
longLevel := longLevel == na and inBuy[1] and low < stopPrice and close < strategy.position_avg_price ? 'SR' : longLevel
longLevel := longLevel == na and mode[1] == 'L1' and inBuy[1] and low < l1LongExit[1] and close >= strategy.position_avg_price ? 'SG' : longLevel
longLevel := longLevel == na and mode[1] == 'L2' and inBuy[1] and low < l2LongExit[1] and close >= strategy.position_avg_price ? 'SG' : longLevel
longLevel := longLevel == na and mode[1] == 'L1' and inBuy[1] and low < l1LongExit[1] and close < strategy.position_avg_price ? 'SR' : longLevel
longLevel := longLevel == na and mode[1] == 'L2' and inBuy[1] and low < l2LongExit[1] and close < strategy.position_avg_price ? 'SR' : longLevel
// Tracks if the trade was a win or loss.
win := longLevel == 'SG' ? true : win
win := longLevel == 'SR' ? false : win
// Variables used to tell strategy when to enter/exit trade.
//plotarrow(fake ? 1 : 0, colordown=color.red, colorup=color.purple, transp=40) // down arrow for winning trade
enterLong = (longLevel == 'L1' or longLevel == 'L2' or longLevel == 'P') and not fake and TradeDateIsAllowed()
exitLong = (longLevel == 'SG' or longLevel == 'SR') and not fake and TradeDateIsAllowed()
p1 = plot(l1LongPlot, title='l1 long', linewidth=3, style=plot.style_stepline, color=color.new(color.green, 0))
p2 = plot(l1LongExit[1], title='l1 exit', linewidth=3, style=plot.style_stepline, color=color.new(color.red, 0))
p3 = plot(l2LongPlot, title='l2 long', linewidth=2, style=plot.style_stepline, color=color.new(color.green, 0))
p4 = plot(l2LongExit[1], title='l2 exit', linewidth=2, style=plot.style_stepline, color=color.new(color.red, 0))
color1 = color.new(color.black, 0)
color2 = color.new(color.black, 100)
col = inBuy ? color1 : color2
p5 = plot(stopPrice, title='stop', linewidth=2, style=plot.style_circles, join=true, color=color.new(color.black, 0))
p6 = plot(nextBuyPrice, title='next buy', linewidth=2, style=plot.style_circles, join=true, color=color.new(color.blue, 0))
fill(p1, p3, color=color.new(color.green, 90))
fill(p2, p4, color=color.new(color.red, 90))
risk = (strategy.initial_capital + strategy.netprofit) * riskPercent
shares := math.floor(risk / (stopInput * n))
capitalLeft := strategy.initial_capital + strategy.netprofit - strategy.position_size * strategy.position_avg_price
if shares * close > capitalLeft
shares := math.max(0, math.floor(capitalLeft / close))
shares
shares := math.max(0, shares)
plotshape(longLevel == 'L1' and not fake and strategy.position_size == 0 ? true : false, color=color.new(color.green, 40), style=shape.triangleup, text='L1 ') // up arrow for entering L1 trade
plotshape(not fake[1] and fake and longLevel == 'L1' and strategy.position_size == 0 ? true : false, color=color.new(color.gray, 40), style=shape.triangleup, text='L1') // up arrow for entering L1 trade
plotshape(longLevel == 'L2' and strategy.position_size == 0 ? true : false, color=color.new(color.green, 40), style=shape.triangleup, text='L2') // up arrow for entering L2 trade
plotshape((mode == 'L1' or mode == 'L2') and shares > 0 and enterLong and strategy.position_size > 0 ? true : false, color=color.new(color.green, 40), style=shape.triangleup, text='P')
plotarrow(strategy.position_size == 0 and longLevel == 'L1' and enterLong ? 1 : 0, colordown=color.new(color.black, 40), colorup=color.new(color.green, 40)) // up arrow for entering L1 trade
plotarrow(strategy.position_size == 0 and longLevel == 'L2' and enterLong ? 1 : 0, colordown=color.new(color.black, 40), colorup=color.new(color.green, 40)) // up arrow for entering L2 trade
plotarrow(strategy.position_size > 0 and longLevel == 'SR' and exitLong ? -1 : 0, colordown=color.new(color.red, 40), colorup=color.new(color.purple, 40)) // down arrow for losing trade
plotarrow(strategy.position_size > 0 and longLevel == 'SG' and exitLong ? -1 : 0, colordown=color.new(color.green, 40), colorup=color.new(color.purple, 40)) // down arrow for winning trade
plotshape(longLevel == na and inBuy[1] and not inBuy, color=color.new(color.gray, 40), style=shape.triangleup, text='Exit') // up arrow for entering L1 trade
plot(ta.atr(atrPeriod), title='ATR', color=color.new(#991515, 0))
plot(strategy.position_avg_price, title='Average Price', color=color.new(#991515, 0))
alertcondition(low < stopPrice, title='crosses under stop price', message='price crossed under stop price')
alertcondition(high > l1Long, title='crosses over L1 price', message='price crossed over L1 price')
alertcondition(high > l2Long, title='crosses over L2 price', message='price crossed over L2 price')
alertcondition(low < l1LongExit, title='crosses under L1 exit price', message='price crossed under L1 exit price')
alertcondition(low < l2LongExit, title='crosses under L2 exit price', message='price crossed under L2 exit price')
strategy.entry('long', strategy.long, qty=shares, comment='long', when=enterLong)
strategy.close('long', when=exitLong)
// simulate_amount = 100000
// simulate_risk = simulate_amount*0.005
// simulate_shares = floor(simulate_risk/(n*stopInput))
// plot(simulate_shares, "Shares", color=#991515, transp=0)
// if (enterLong)
// label.new(bar_index, high, text=tostring(simulate), style=label.style_none)