Ringkasan
Strategi ini menggunakan indikator yang relatif kuat (RSI) dan rata-rata bergerak sederhana (SMA) untuk mengidentifikasi potensi kondisi overbought dan peluang reversal, dan untuk mengoptimalkan rasio risiko-keuntungan dengan cara membangun posisi secara batch. Inti dari strategi ini adalah bahwa harga aset berada dalam tren menurun jangka panjang dan terjadi short-term overbought dan posisi kosong ketika terjadi oversold atau sinyal perubahan tren di pasar.
Prinsip Strategi
Strategi ini terdiri dari beberapa langkah utama:
- Penilaian tren jangka panjang: Gunakan 200-day Simple Moving Average (SMA) sebagai filter tren jangka panjang. Strategi hanya akan mempertimbangkan peluang shorting jika harga berada di bawah 200-day SMA.
- Identifikasi kondisi overbought: Menggunakan indikator RSI 2 siklus lebih tinggi dari 75 selama dua hari berturut-turut untuk menilai kondisi overbought jangka pendek.
- Pembentukan gudang secara batch: Pembentukan gudang awal adalah 10% dari posisi, kemudian meningkatkan posisi secara bertahap sesuai dengan pergerakan harga. Ketika harga lebih tinggi dari harga pembentukan gudang terakhir, masing-masing meningkatkan posisi sebesar 20%, 30% dan 40%.
- Kondisi Keluar: Tutup semua posisi ketika RSI 2 siklus lebih rendah dari 30 (menunjukkan kemungkinan oversold) atau melewati 30 SMA pada SMA 10 (menunjukkan kemungkinan pembalikan tren).
Keunggulan Strategis
- Pengendalian risiko: Mengontrol risiko yang efektif dari setiap transaksi dengan membangun gudang secara batch dan mengelola posisi yang dinamis.
- Pelacakan tren: Menggunakan kombinasi rata-rata bergerak jangka panjang untuk menangkap tren jangka panjang dan mengidentifikasi peluang pembalikan jangka pendek.
- Fleksibilitas: Parameter strategi dapat disesuaikan dengan berbagai kondisi pasar dan jenis transaksi, dan sangat mudah beradaptasi.
- Eksekusi otomatis: Strategi logis yang jelas dan mudah diprogram untuk mengotomatisasi transaksi.
Risiko Strategis
- Resiko pasar: risiko kerugian yang terus berlanjut dalam situasi kenaikan harga yang kuat
- Risiko overpricing: mekanisme overpricing batch dapat menyebabkan eksposur yang berlebihan ke pasar di bawah sinyal yang salah.
- Risiko likuiditas: Di pasar yang kurang likuiditas, transaksi besar dapat menyebabkan peningkatan slippage.
- Keterbatasan indikator teknis: Indikator teknis seperti RSI dan SMA dapat menghasilkan sinyal palsu yang menyebabkan keputusan perdagangan yang salah.
Arah optimasi strategi
- Memperkenalkan indikator volatilitas: Menggabungkan indikator volatilitas seperti ATR (Average True Range) untuk secara dinamis menyesuaikan nilai terendah posisi.
- Optimalkan logika pegangan: Anda dapat mempertimbangkan untuk menyesuaikan rasio pegangan secara dinamis sesuai dengan tingkat fluktuasi pasar, untuk menghindari pegangan berlebihan pada periode fluktuasi tinggi.
- Menambahkan filter dasar: menggabungkan faktor dasar seperti indikator sentimen pasar atau data ekonomi makro untuk meningkatkan keandalan sinyal masuk.
- Optimasi Retrospektif: Optimalkan pengaturan parameter dengan banyak data historis untuk meningkatkan stabilitas dan profitabilitas strategi.
Meringkaskan
Strategi berbalik overbought RSI adalah strategi perdagangan garis pendek yang menggabungkan analisis teknis dan manajemen risiko. Strategi ini bertujuan untuk menangkap peluang berbalik pasar yang potensial dengan memanfaatkan sinyal overbought RSI dan penilaian tren SMA.
/*backtest
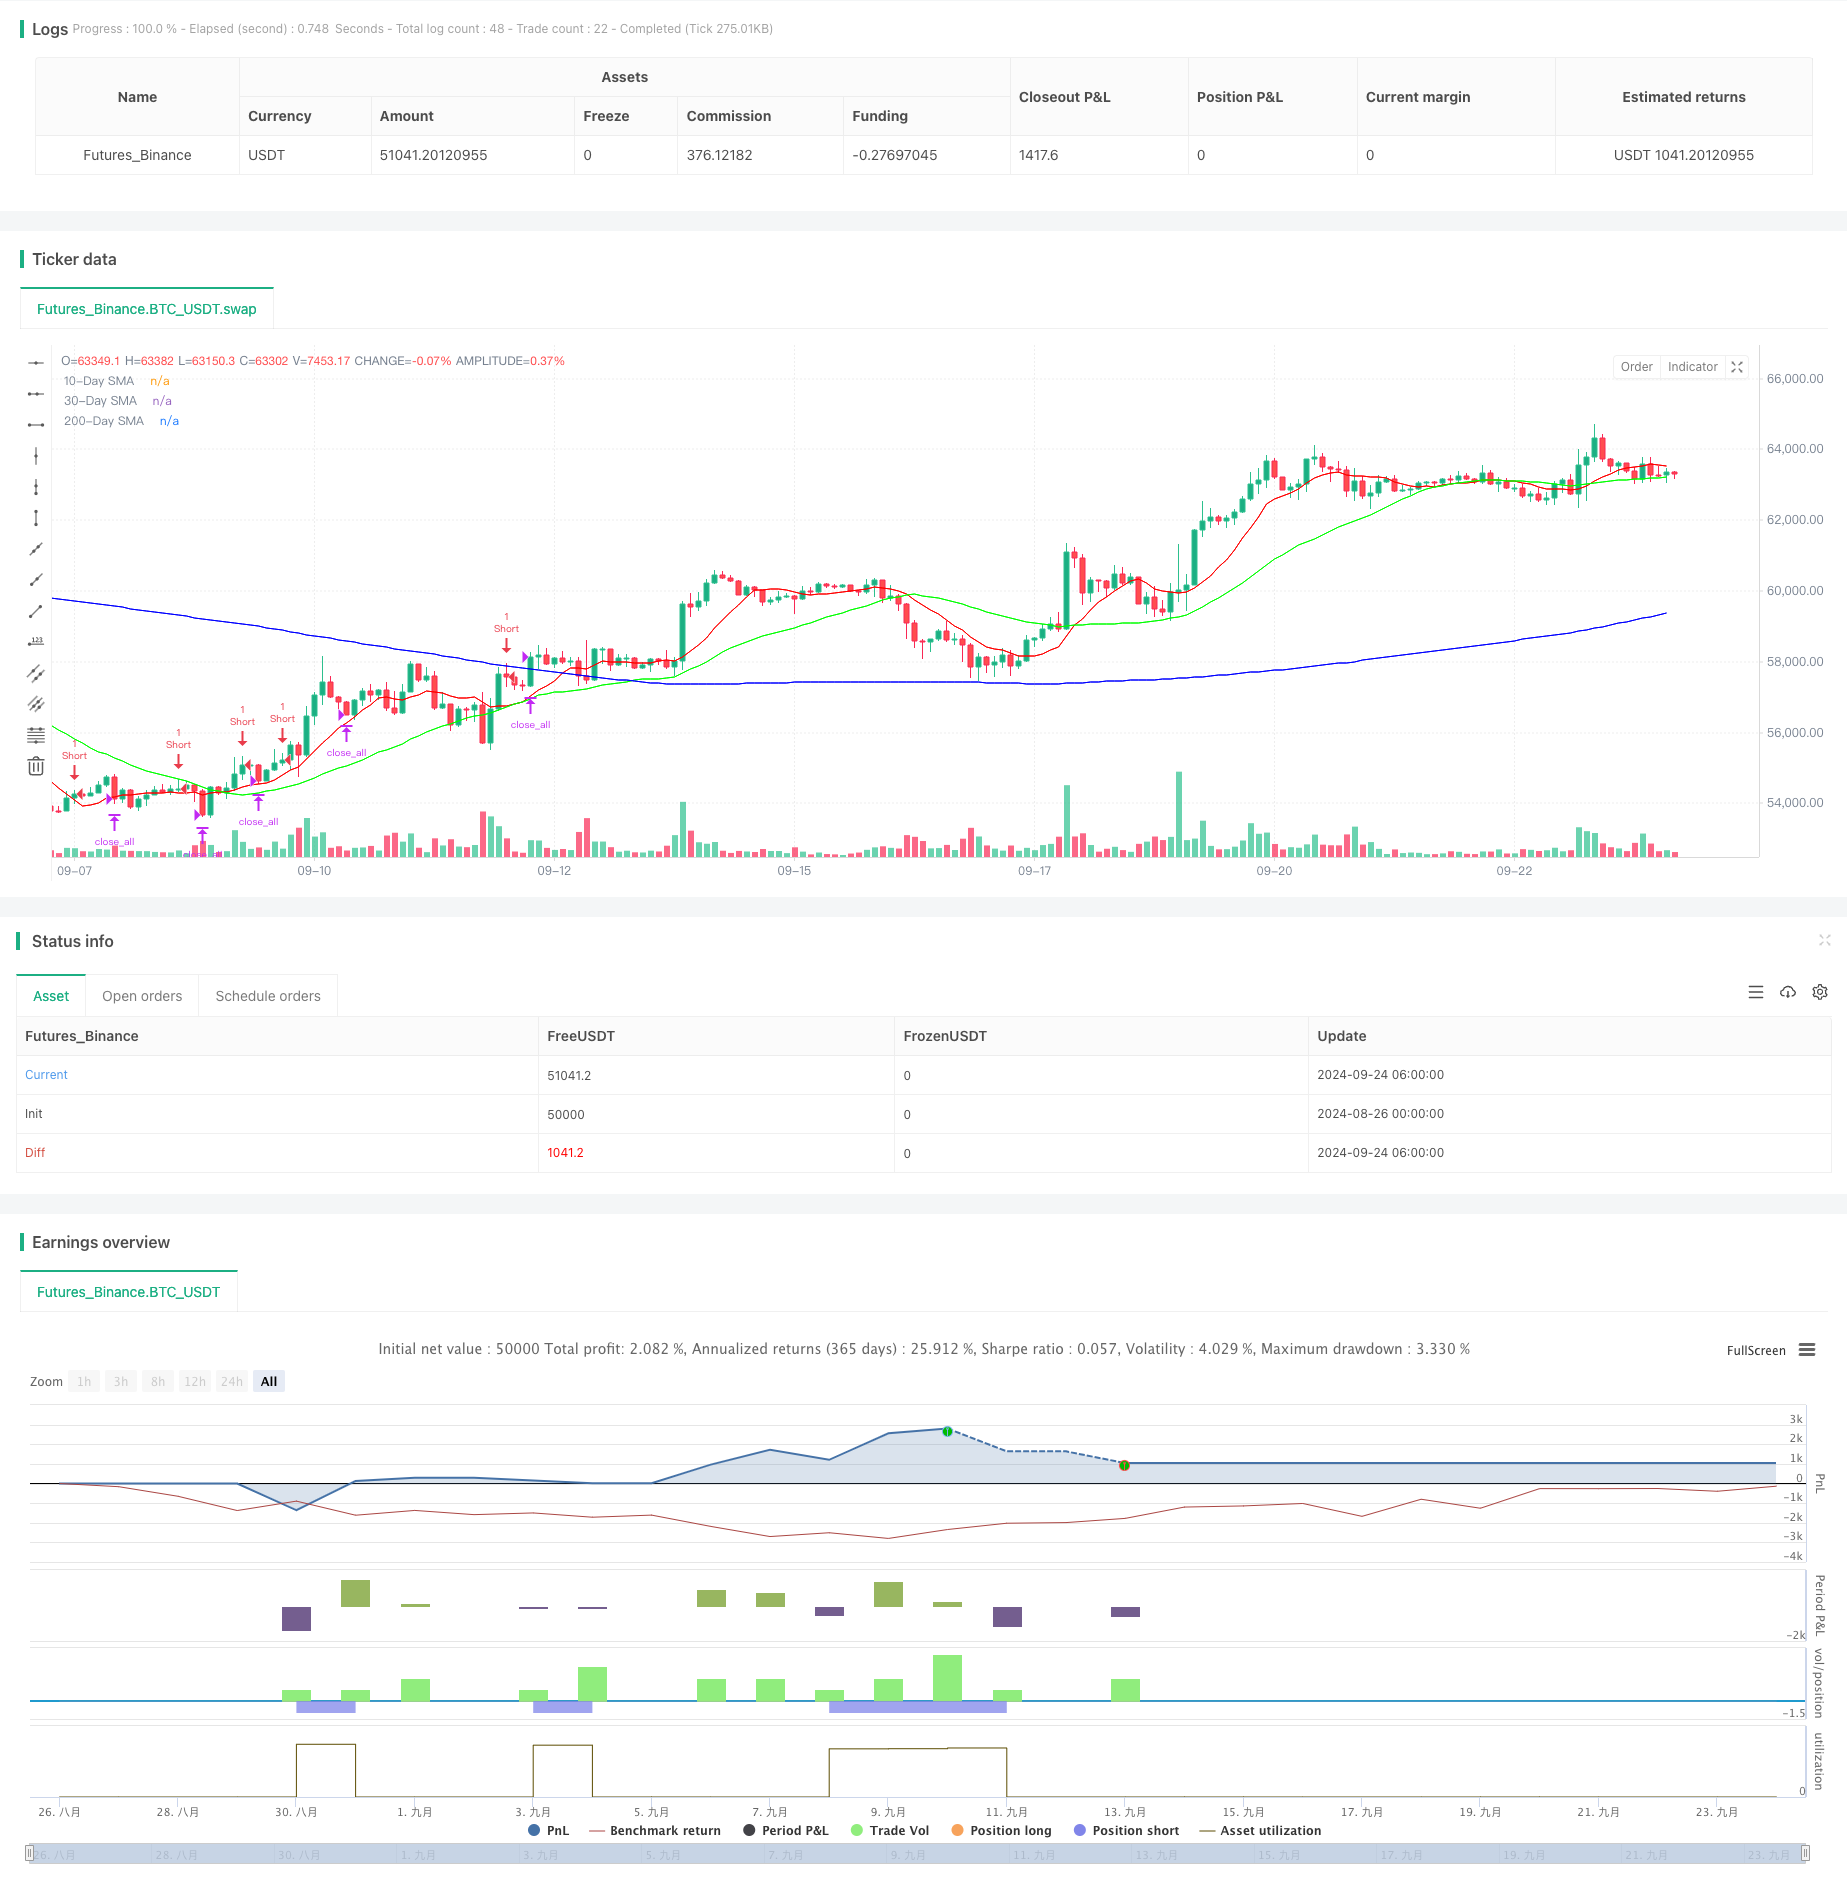
start: 2024-08-26 00:00:00
end: 2024-09-24 08:00:00
period: 2h
basePeriod: 2h
exchanges: [{"eid":"Futures_Binance","currency":"BTC_USDT"}]
*/
//@version=5
strategy("TPS Short Strategy by Larry Conners", overlay=true)
// Define parameters as inputs
sma_length_200 = input.int(200, title="200-Day SMA Length")
rsi_length_2 = input.int(2, title="2-Period RSI Length")
sma_length_10 = input.int(10, title="10-Day SMA Length")
sma_length_30 = input.int(30, title="30-Day SMA Length")
// Define colors as RGB values
color_sma_200 = input.color(color.rgb(0, 0, 255), title="200-Day SMA Color") // Blue
color_sma_10 = input.color(color.rgb(255, 0, 0), title="10-Day SMA Color") // Red
color_sma_30 = input.color(color.rgb(0, 255, 0), title="30-Day SMA Color") // Green
// Calculate indicators
sma_200 = ta.sma(close, sma_length_200)
rsi_2 = ta.rsi(close, rsi_length_2)
sma_10 = ta.sma(close, sma_length_10)
sma_30 = ta.sma(close, sma_length_30)
// Define conditions
below_sma_200 = close < sma_200
rsi_2_above_75_two_days = rsi_2[1] > 75 and rsi_2 > 75
price_higher_than_entry = na(strategy.opentrades.entry_price(0)) ? false : close > strategy.opentrades.entry_price(0)
// Entry conditions
if (below_sma_200 and rsi_2_above_75_two_days and na(strategy.opentrades.entry_price(0)))
strategy.entry("Short", strategy.short, qty=1) // Short 10% of the position
// Scaling in conditions
if (price_higher_than_entry)
strategy.entry("Short2", strategy.short, qty=2) // Short 20% more of the position
if (price_higher_than_entry)
strategy.entry("Short3", strategy.short, qty=3) // Short 30% more of the position
if (price_higher_than_entry)
strategy.entry("Short4", strategy.short, qty=4) // Short 40% more of the position
// Exit conditions
exit_condition_rsi_below_30 = rsi_2 < 30
exit_condition_sma_cross = ta.crossover(sma_10, sma_30)
if (exit_condition_rsi_below_30 or exit_condition_sma_cross)
strategy.close_all() // Close all positions
// Plot indicators
plot(sma_200, color=color_sma_200, title="200-Day SMA")
plot(sma_10, color=color_sma_10, title="10-Day SMA")
plot(sma_30, color=color_sma_30, title="30-Day SMA")