Strategi mengikuti tren pembalikan rata-rata berdasarkan beberapa indikator teknis

Ringkasan
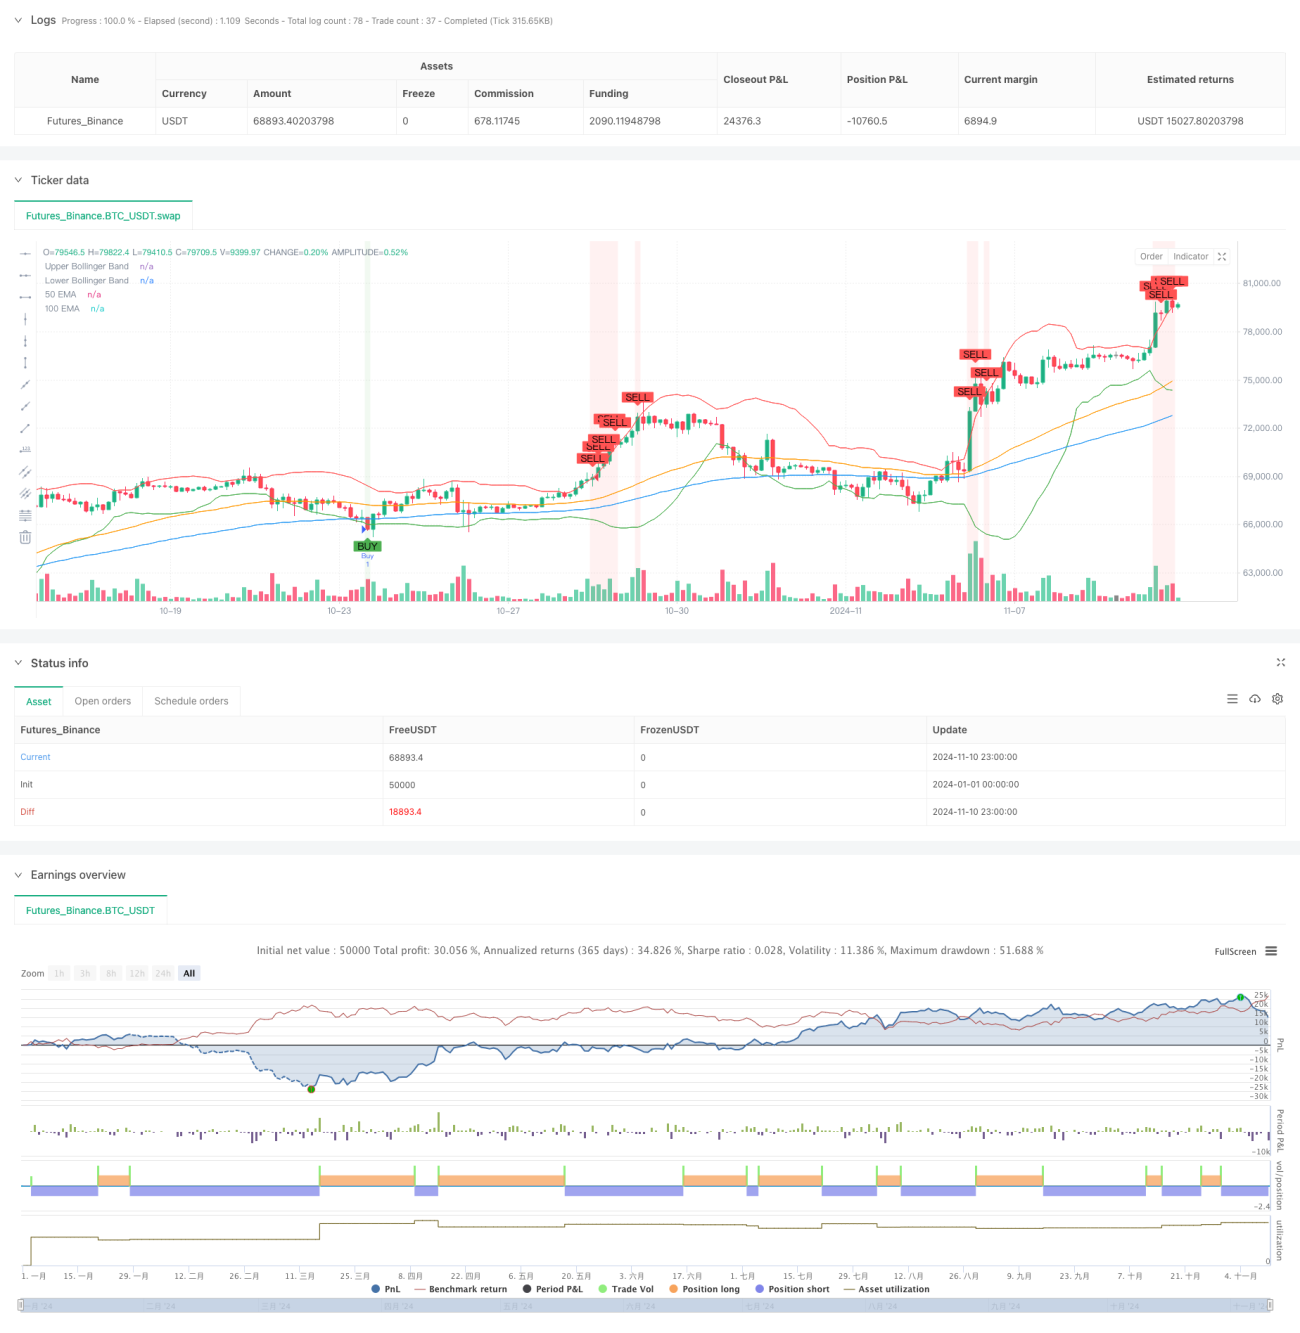
Strategi ini adalah sistem strategi campuran yang menggabungkan regresi rata-rata dan pelacakan tren, terutama untuk menangkap peluang overbought dan oversold di pasar melalui kombinasi RSI, Bollinger Bands, dan beberapa indikator EMA. Strategi ini didasarkan pada indikator analisis teknis tradisional, meningkatkan penghakiman terhadap konfirmasi tren dan range oscillation, yang secara efektif meningkatkan akurasi strategi.
Prinsip Strategi
Strategi ini menggunakan mekanisme triple-verifikasi untuk mengkonfirmasi sinyal perdagangan. Pertama, dengan indikator RSI untuk mengidentifikasi area overbought dan oversold, sinyal awal akan dipicu ketika RSI berada di bawah 30 atau di atas 70. Kemudian, dengan menggunakan Bollinger Band ((BB) sebagai referensi untuk rentang fluktuasi harga, sinyal konfirmasi lebih lanjut akan dilakukan ketika harga menembus tren naik atau turun.
Keunggulan Strategis
- Verifikasi silang berbagai indikator teknis, mengurangi sinyal palsu secara signifikan
- Adaptasi strategi yang lebih baik dengan kombinasi overbought dan oversold dan trend tracking
- Pengertian Volatilitas Rata-Rata untuk Identifikasi Efektif Pasar Penyusunan
- Efek visualisasi yang jelas untuk memantau dan mengoptimalkan strategi
- Parameter yang dapat disesuaikan untuk berbagai kondisi pasar
Risiko Strategis
- Beberapa indikator dapat menyebabkan kelambatan sinyal
- Peluang perdagangan yang mungkin terlewatkan di pasar yang sangat bergejolak
- Optimasi parameter yang berlebihan dapat menyebabkan overfitting
- Penilaian tren EMA dapat menimbulkan sinyal kebingungan di pasar horizontal
Disarankan untuk memverifikasi stabilitas strategi dengan menelusuri data dari periode waktu yang berbeda, dan mengatur stop loss yang tepat untuk mengendalikan risiko.
Arah optimasi strategi
- Menambahkan indikator volume transaksi sebagai konfirmasi tambahan
- Memperkenalkan mekanisme penyesuaian parameter adaptif
- Tambahkan modul manajemen stop loss
- Mengembangkan sistem penilaian intensitas tren
- Optimalkan metode perhitungan volatilitas EMA
- Menambahkan filter volatilitas pasar
Meringkaskan
Strategi ini bekerja sama dengan beberapa indikator teknis, yang memungkinkan fleksibilitas strategi dengan memastikan stabilitas. Strategi ini memiliki logika yang jelas, implementasi yang sederhana, dan nilai praktis yang baik. Dengan optimasi parameter yang masuk akal dan manajemen risiko, strategi ini diharapkan dapat mempertahankan kinerja yang stabil di berbagai lingkungan pasar.
- 1