Strategi Gabungan Momentum RSI Multi-periode dan Tren Mengikuti Triple EMA

Ringkasan
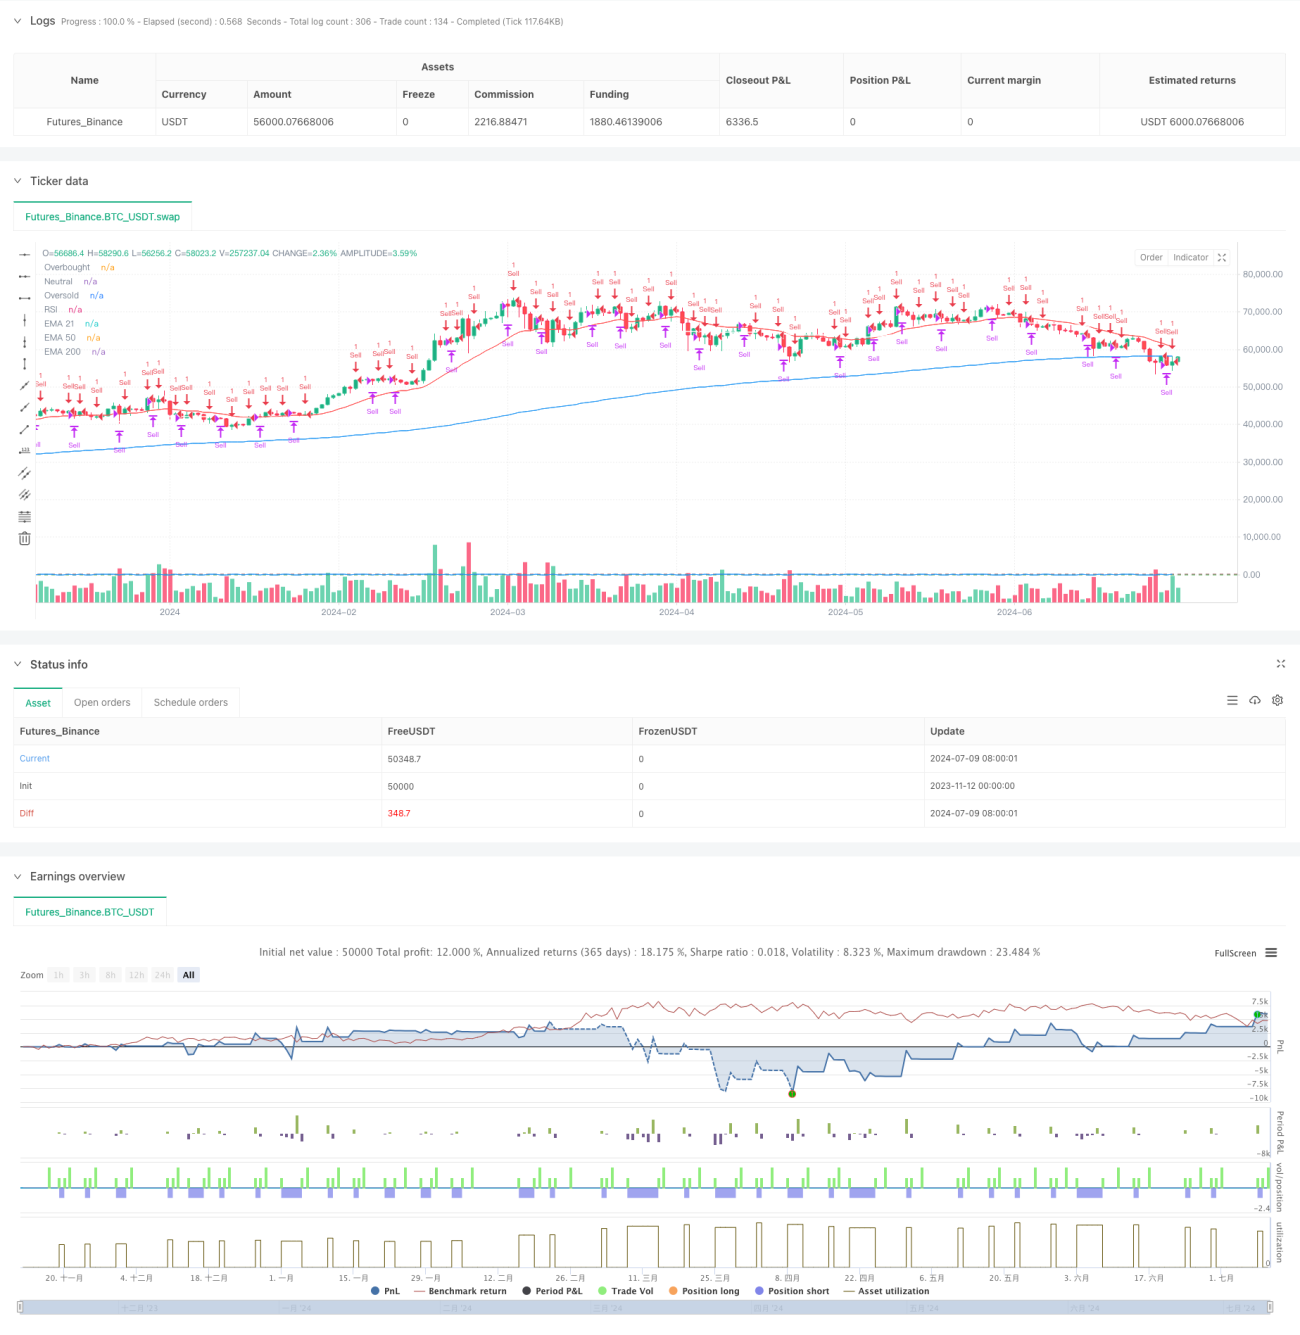
Strategi ini adalah sistem perdagangan komposit yang menggabungkan indikator momentum RSI dan indikator tren EMA. Ini berjalan pada dua periode waktu 1 menit dan 5 menit, dan keputusan perdagangan dibuat melalui sinyal overbought dan oversold RSI dan penilaian tren EMA tiga kali lipat. Strategi ini mencakup fitur pelacakan tren dan pengembalian rata-rata, yang dapat menangkap peluang perdagangan dalam berbagai kondisi pasar.
Prinsip Strategi
Strategi menggunakan 21/50/200 hari triple EMA sebagai acuan untuk menentukan tren, dan digabungkan dengan RSI versi yang diperbaiki (dihitung dengan metode Chebyshev) untuk mengidentifikasi kondisi overbought dan oversold di pasar. Pada siklus 1 menit, buka shorting saat RSI menembus 94, turun di posisi terendah 4, dan tetapkan stop loss jaminan saat RSI kembali ke 50. Pada siklus 5 menit, buka overbought saat harga menembus 200 hari EMA dan bangkit kembali, dan turun di posisi terendah saat RSI menembus atau turun.
Keunggulan Strategis
- Analisis siklus waktu ganda meningkatkan keandalan sinyal
- Kombinasi Indikator Tren dan Momentum, saling melengkapi
- Mempunyai mekanisme penghentian kerugian dan pengendalian risiko
- Dengan metode RSI yang lebih baik, sinyal lebih akurat.
- Menghindari transaksi berulang dengan manajemen posisi
- Adaptasi terhadap kondisi pasar yang berbeda
Risiko Strategis
- Transaksi yang sering dapat menyebabkan biaya yang lebih tinggi
- Stop loss yang mungkin sering terjadi dalam pasar yang bergejolak
- Indeks RSI dapat menghasilkan sinyal palsu dalam kondisi pasar tertentu
- Strategi multi-siklus mungkin terlambat dalam pengakuan sinyal
- Sinyal silang EMA dapat menyesatkan pasar yang bergoyang
Arah optimasi strategi
- Masukkan filter tingkat fluktuasi untuk menyesuaikan parameter selama fluktuasi tinggi
- Meningkatkan mekanisme konfirmasi volume transaksi
- Optimalkan RSI, pertimbangkan untuk melakukan penyesuaian dinamis
- Menambahkan indikator teknis untuk verifikasi silang
- Memperkenalkan mekanisme parameter adaptif
- Mengembangkan mekanisme penghentian kerugian yang lebih halus
Meringkaskan
Strategi ini meningkatkan stabilitas dan keandalan perdagangan dengan menggabungkan beberapa indikator teknis dan analisis siklus waktu ganda. Meskipun ada risiko tertentu, risiko dapat dikendalikan secara efektif dengan manajemen posisi yang masuk akal dan mekanisme stop loss.
- 1