Ringkasan
Artikel ini membahas tentang sistem perdagangan pelacakan tren yang menggabungkan kotak Darvas dan rata-rata bergerak 25 periode. Strategi ini menggunakan identifikasi kotak yang terbentuk di seluruh area harga, dan menggabungkan konfirmasi tren rata-rata, untuk menangkap tren kuat ketika terjadi penembusan. Sistem ini dirancang dengan mempertimbangkan kontinuitas tren dan filter penembusan palsu, memberikan pedagang dengan kerangka masuk dan keluar pasar yang lengkap.
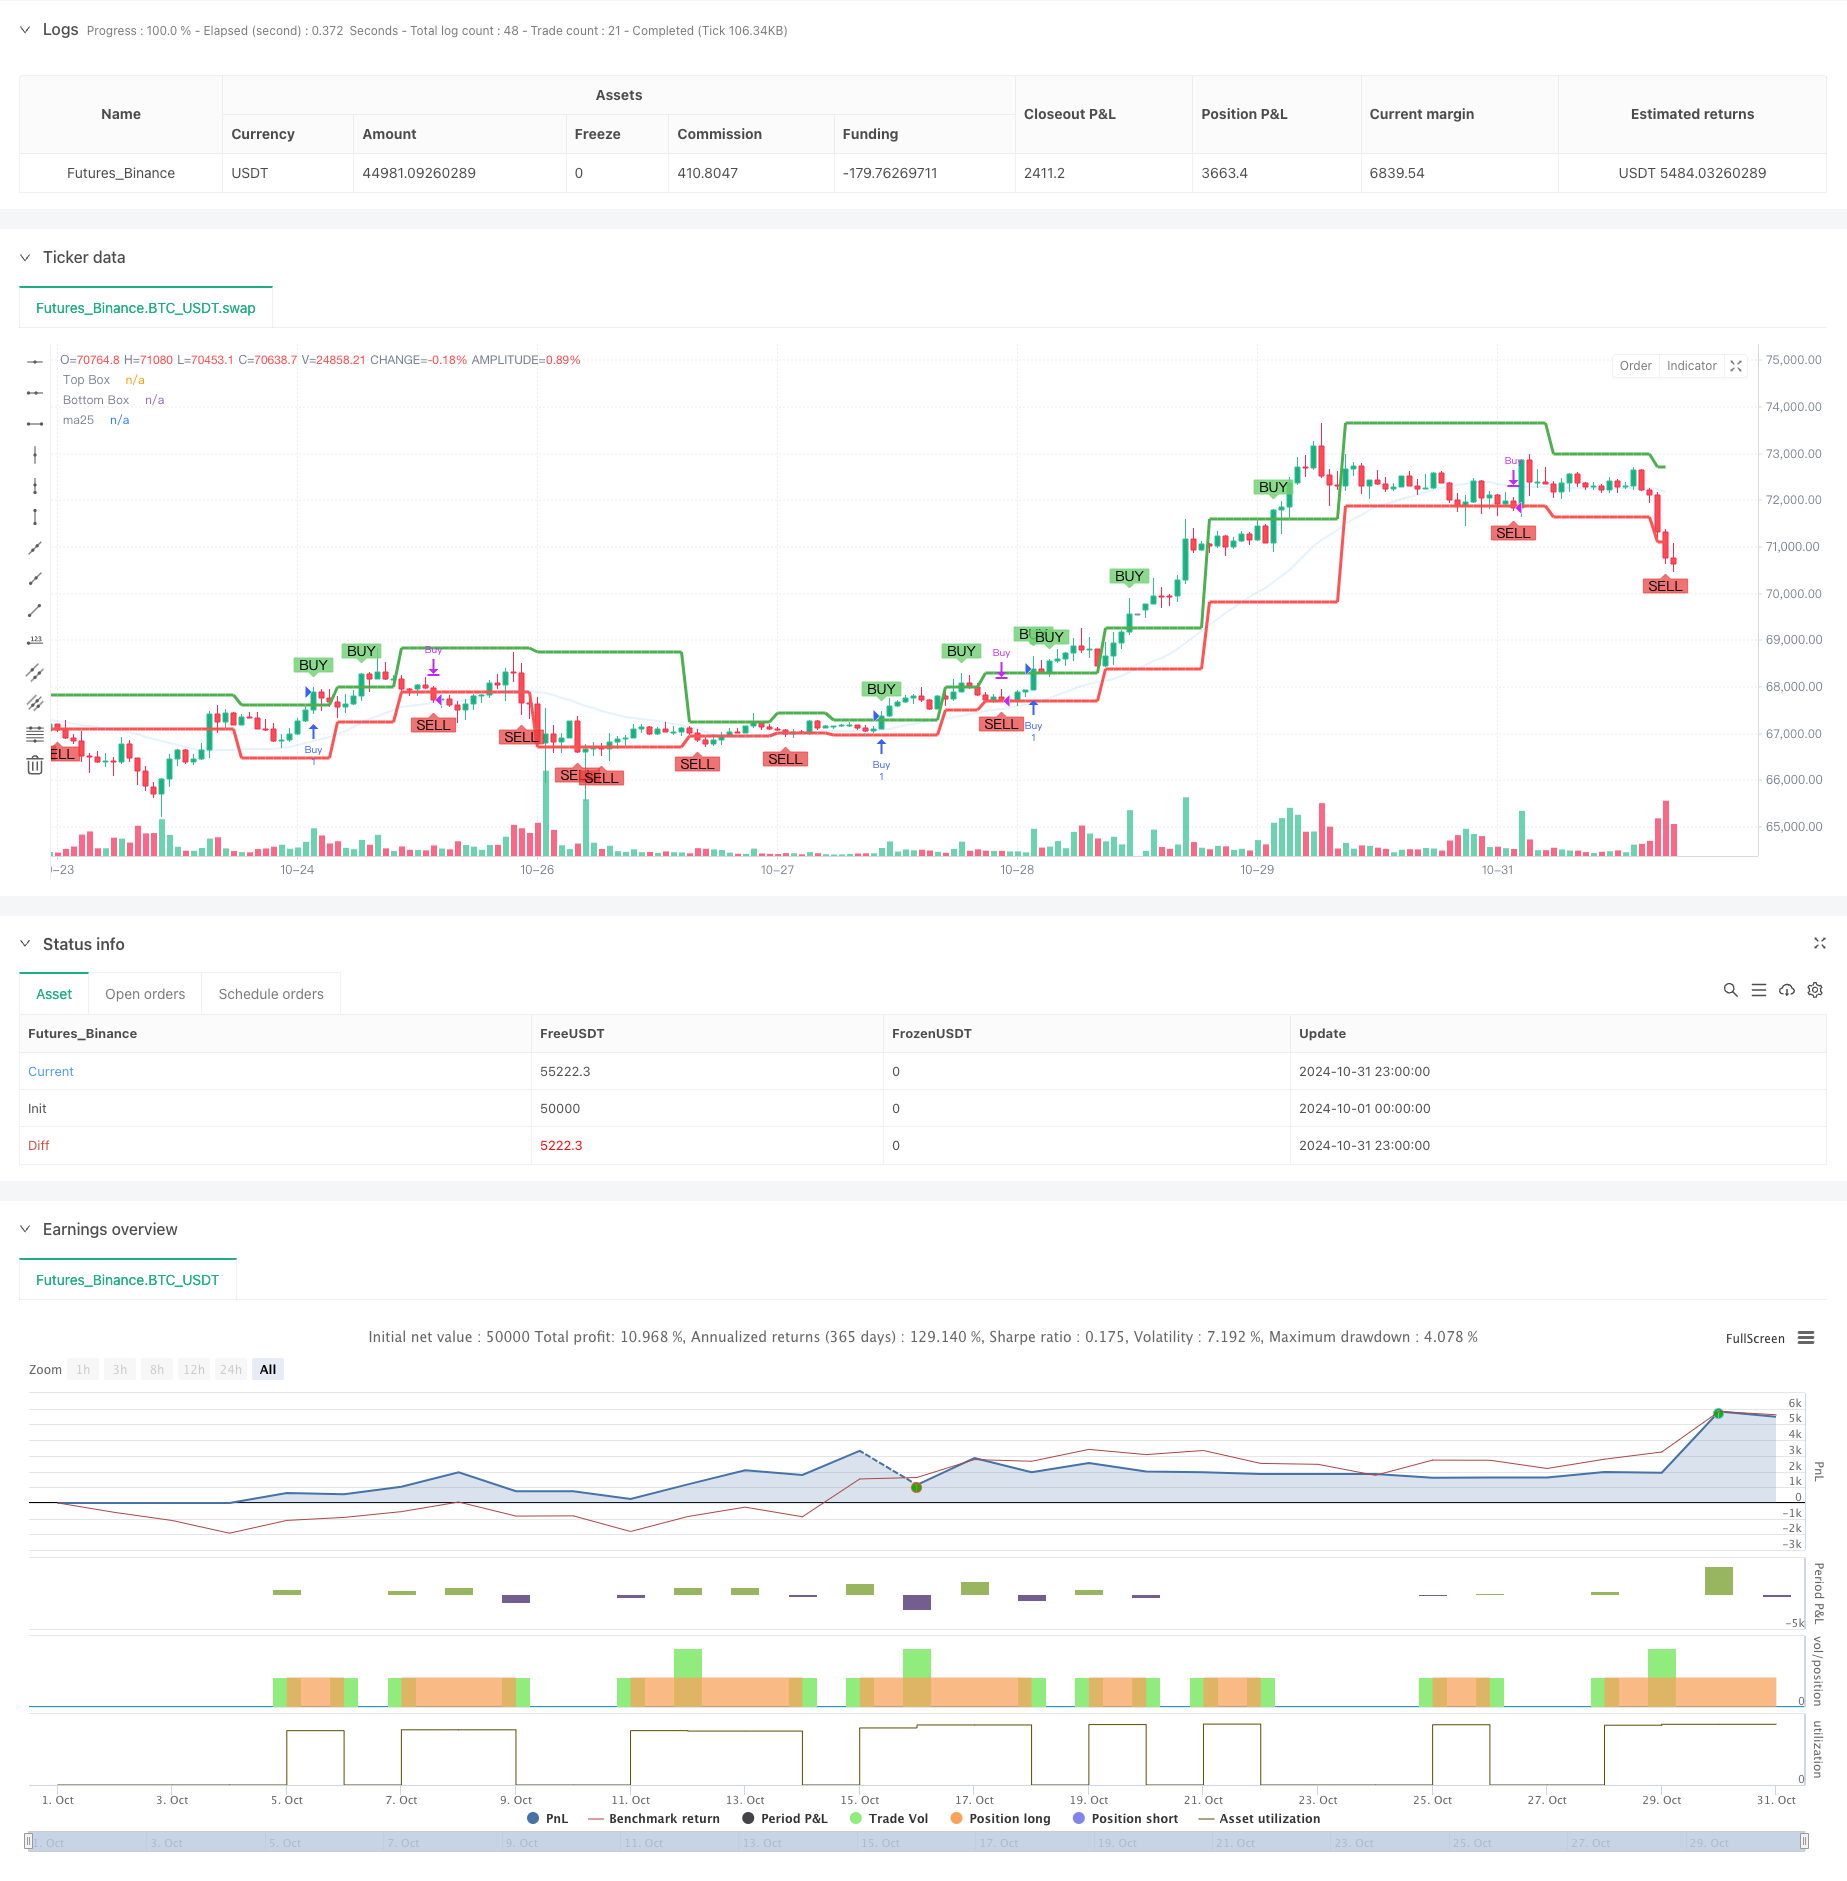
Prinsip Strategi
Strategi ini terdiri dari tiga komponen utama:
- Konstruksi kotak Davos: Sistem menentukan batas kotak dengan menghitung harga tertinggi dan terendah selama 5 siklus terakhir. Bagian atas kotak ditentukan oleh titik tertinggi baru, dan bagian bawah oleh titik terendah dalam kisaran yang sesuai.
- Konfirmasi tren rata-rata: Masukkan rata-rata bergerak sederhana 25 periode sebagai filter tren, hanya untuk mempertimbangkan posisi ketika harga berada di atas MA25.
- Sinyal perdagangan dihasilkan:
- Sinyal beli: harga menembus bagian atas kotak dan berada di atas MA25
- Sinyal Penjualan: Harga Menjatuhkan Bagian Bawah
Keunggulan Strategis
- Keahlian untuk melacak tren:
- Tren Penangkapan Melalui Penembusan Kotak Dimulai
- Kombinasi dengan filter MA25 untuk memastikan perdagangan di arah tren utama
- Optimalisasi kualitas sinyal:
- Mekanisme konfirmasi ganda mengurangi risiko penembusan palsu
- Kondisi masuk dan keluar yang jelas, menghindari penilaian subjektif
- Pengendalian risiko:
- Stop loss terbentuk secara alami di bagian bawah kotak
- MA25 memberikan perlindungan tren tambahan
Risiko Strategis
- Risiko pasar yang bergejolak:
- Penembusan sering dapat menyebabkan kerugian berturut-turut
- Disarankan untuk digunakan di pasar tren yang kuat
- Risiko keterbelakangan:
- Pembentukan tubuh membutuhkan waktu, mungkin ada bagian yang hilang.
- MA25 sebagai garis rata-rata jangka menengah ada keterlambatan tertentu
- Manajemen risiko:
- Rasio modal yang perlu diatur secara masuk akal untuk setiap transaksi
- Rekomendasi untuk menyesuaikan posisi dengan fluktuasi dinamika
Arah optimasi strategi
- Optimalisasi parameter:
- Dapat disesuaikan dengan karakteristik pasar yang berbeda
- Siklus MA dapat disesuaikan dengan karakteristik siklus pasar
- Peningkatan sinyal:
- Mekanisme konfirmasi pengiriman yang dapat ditambahkan
- Pertimbangan untuk memperkenalkan mekanisme stop loss dinamis
- Pengendalian risiko yang lebih kuat:
- Tambahkan Filter Volatilitas
- Mewujudkan manajemen posisi dinamis
Meringkaskan
Strategi ini membangun sistem perdagangan yang solid dengan menggabungkan teori kotak Davos klasik dan pelacakan tren rata-rata bergerak. Keunggulan utama sistem ini adalah kemampuan untuk secara efektif menangkap perilaku yang berorientasi pada tren, sekaligus mengendalikan risiko melalui mekanisme pemfilteran ganda. Meskipun ada beberapa keterbelakangan, strategi ini dapat memperoleh kinerja yang stabil di pasar yang berorientasi pada tren melalui optimasi parameter dan manajemen risiko yang masuk akal.
/*backtest
start: 2024-10-01 00:00:00
end: 2024-10-31 23:59:59
period: 1h
basePeriod: 1h
exchanges: [{"eid":"Futures_Binance","currency":"BTC_USDT"}]
*/

//@version=5
strategy("DARVAS BOX with MA25 Buy Condition", overlay=true, shorttitle="AEG DARVAS")

// Input for box length
boxp = input.int(5, "BOX LENGTH")

// Calculate 25-period moving average
ma25 = ta.sma(close, 25)

// Lowest low and highest high within the box period
LL = ta.lowest(low, boxp)
k1 = ta.highest(high, boxp)
k2 = ta.highest(high, boxp - 1)
k3 = ta.highest(high, boxp - 2)

// New high detection
NH = ta.valuewhen(high > k1[1], high, 0)

// Logic to detect top and bottom of Darvas Box
box1 = k3 < k2
TopBox = ta.valuewhen(ta.barssince(high > k1[1]) == boxp - 2 and box1, NH, 0)
BottomBox = ta.valuewhen(ta.barssince(high > k1[1]) == boxp - 2 and box1, LL, 0)

// Plot the top and bottom Darvas Box lines
plot(TopBox, linewidth=3, color=color.green, title="Top Box")
plot(BottomBox, linewidth=3, color=color.red, title="Bottom Box")
plot(ma25, color=#2195f31e, linewidth=2, title="ma25")

// --- Buy and Sell conditions ---

// Buy when price breaks above the Darvas Box AND MA15
buyCondition = ta.crossover(close, TopBox) and close > ma25

// Sell when price drops below the Darvas Box
sellCondition = ta.crossunder(close, BottomBox)

// --- Buy and Sell Signals ---

// Plot BUY+ and SELL labels
plotshape(series=buyCondition, title="Buy+ Signal", location=location.abovebar, color=#72d174d3, style=shape.labeldown, text="BUY")
plotshape(series=sellCondition, title="Sell Signal", location=location.belowbar, color=color.rgb(234, 62, 62, 28), style=shape.labelup, text="SELL")

// --- Strategy execution ---

if (buyCondition)
    strategy.entry("Buy", strategy.long)

if (sellCondition)
    strategy.close("Buy")