Strategi perdagangan dua arah dengan penembusan volatilitas besar: sistem entri panjang dan pendek berdasarkan ambang batas poin

Ringkasan
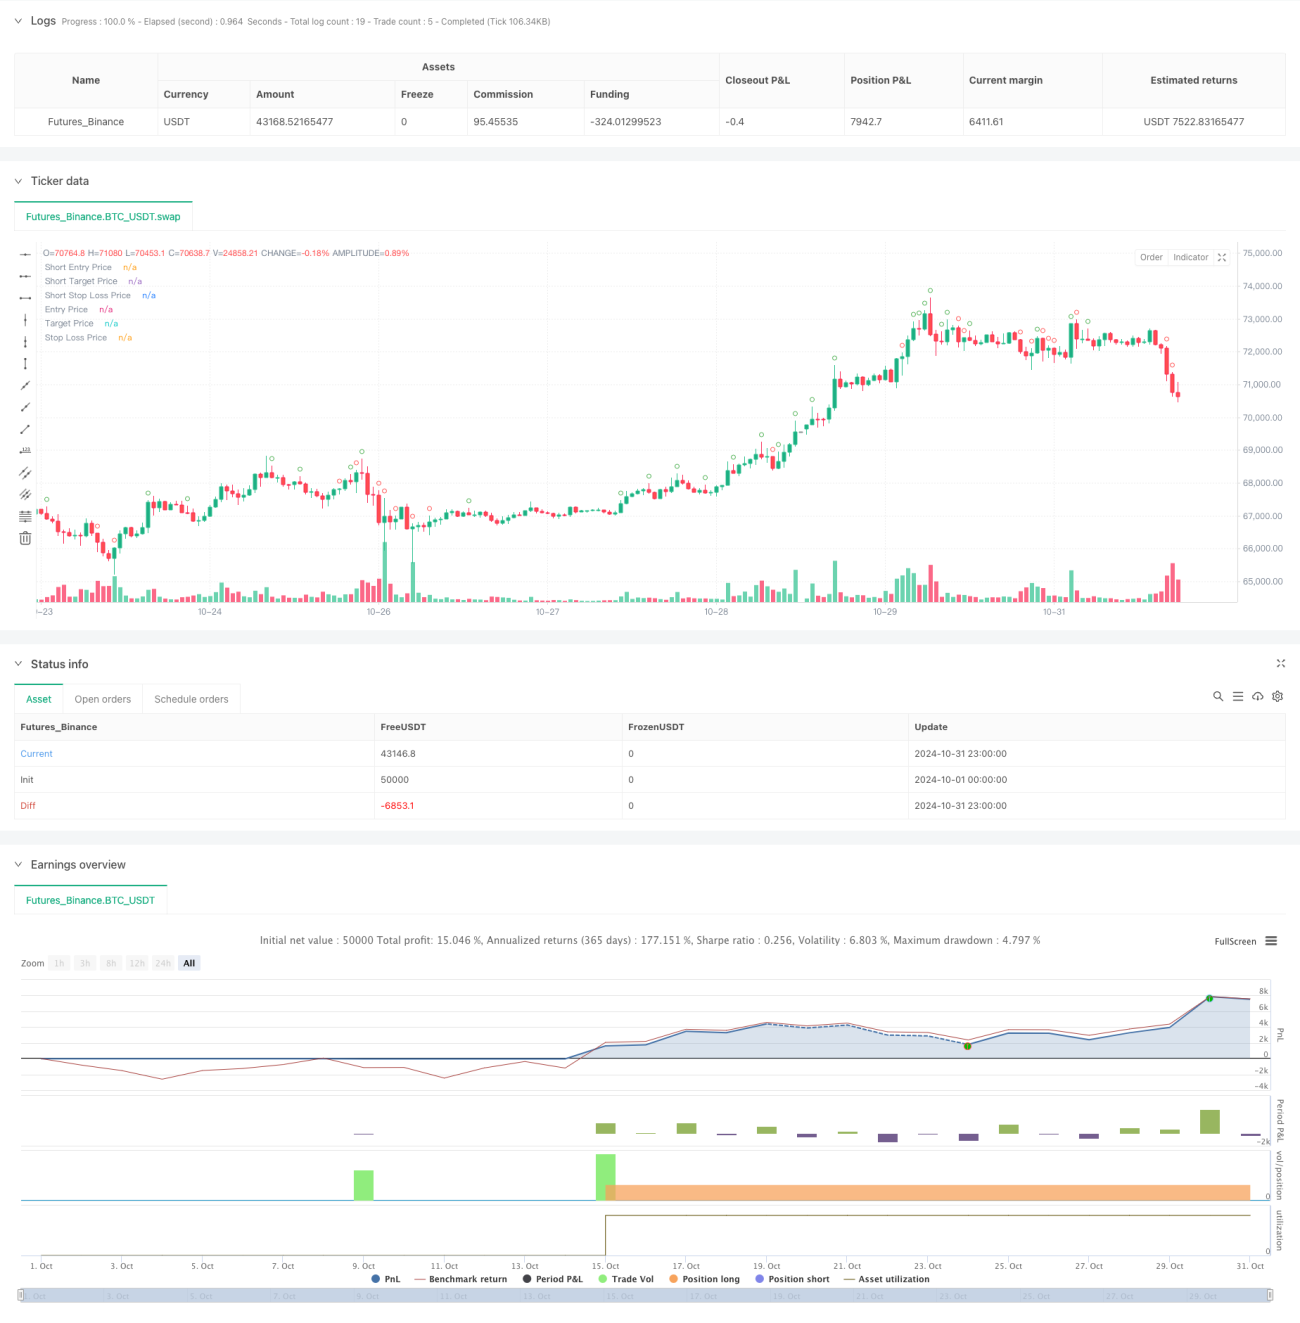
Strategi ini adalah sistem perdagangan dua arah berdasarkan 30 menit K-line untuk mencari peluang perdagangan dengan memantau amplitudo fluktuasi harga. Inti dari strategi ini adalah untuk mengidentifikasi fluktuasi besar dengan menetapkan titik terendah dan melakukan perdagangan di arah yang sesuai setelah konfirmasi terobosan. Strategi ini mencakup manajemen waktu yang ketat, stop loss dan mekanisme manajemen perdagangan untuk memungkinkan perdagangan otomatis yang dapat dikontrol risiko.
Prinsip Strategi
Strategi ini menggunakan mekanisme pemfilteran ganda untuk mengidentifikasi sinyal perdagangan yang efektif. Pertama, strategi ini menghitung rentang fluktuasi entitas setiap 30 menit pada penutupan K-line, yang akan ditandai sebagai peluang perdagangan potensial ketika amplitudo fluktuasi melebihi batas default. Untuk memastikan efektivitas perdagangan, strategi ini menetapkan titik penyangga tambahan, yang hanya akan memicu sinyal perdagangan nyata ketika harga menembus zona penyangga ini.
Keunggulan Strategis
- Manajemen waktu yang baik: membatasi jendela waktu perdagangan, menghindari sinyal palsu saat tidak aktif
- Mekanisme perdagangan dua arah: menangkap peluang dua arah di pasar dan meningkatkan efisiensi penggunaan dana
- Pengendalian risiko yang sempurna: Stop loss dengan titik-titik tetap untuk memudahkan penilaian dan manajemen risiko
- Tingkat otomatisasi yang tinggi: otomatisasi dari pengenalan sinyal hingga eksekusi transaksi, mengurangi intervensi manusia
- Fleksibilitas pengaturan parameter: parameter kunci dapat disesuaikan untuk menyesuaikan dengan lingkungan pasar yang berbeda
Risiko Strategis
- Risiko False Breakout: False breakout dapat terjadi setelah volatilitas yang besar, yang menyebabkan stop loss
- Sensitivitas parameter: pengaturan ambang yang tidak tepat dapat menyebabkan peluang yang terlewatkan atau overtrading
- Ketergantungan pada kondisi pasar: kemungkinan seringnya trigger stop loss dalam pasar yang bergejolak
- Efek slippage: Pada periode fluktuasi tinggi, harga transaksi aktual mungkin memiliki deviasi besar dari harga sinyal
- Manajemen risiko dana: kurangnya mekanisme manajemen posisi dapat menyebabkan risiko yang terlalu besar
Arah optimasi strategi
- Meningkatkan filter tren: Meningkatkan kualitas sinyal dengan kombinasi indikator tren dengan periode yang lebih lama
- Optimasi parameter dinamis: penyesuaian otomatis parameter threshold dan stop loss sesuai dengan fluktuasi pasar
- Pengenalan konfirmasi transfer: peningkatan kondisi penyaringan transfer dan peningkatan keandalan penembusan
- Optimalkan Stop Loss: Membuat Stop Loss Dinamis untuk Beradaptasi dengan Berbagai Kondisi Pasar
- Menambahkan manajemen posisi: menyesuaikan posisi secara dinamis berdasarkan intensitas sinyal dan volatilitas pasar
Meringkaskan
Ini adalah strategi perdagangan otomatis yang dirancang secara logis dan jelas. Strategi ini memiliki kepraktisan yang baik melalui penyaringan kondisi dan kontrol risiko yang ketat. Namun, masih perlu pengujian dan pengoptimalan yang memadai di lapangan, terutama dalam pengaturan parameter dan kontrol risiko yang perlu disesuaikan dengan situasi pasar yang sebenarnya.
- 1