
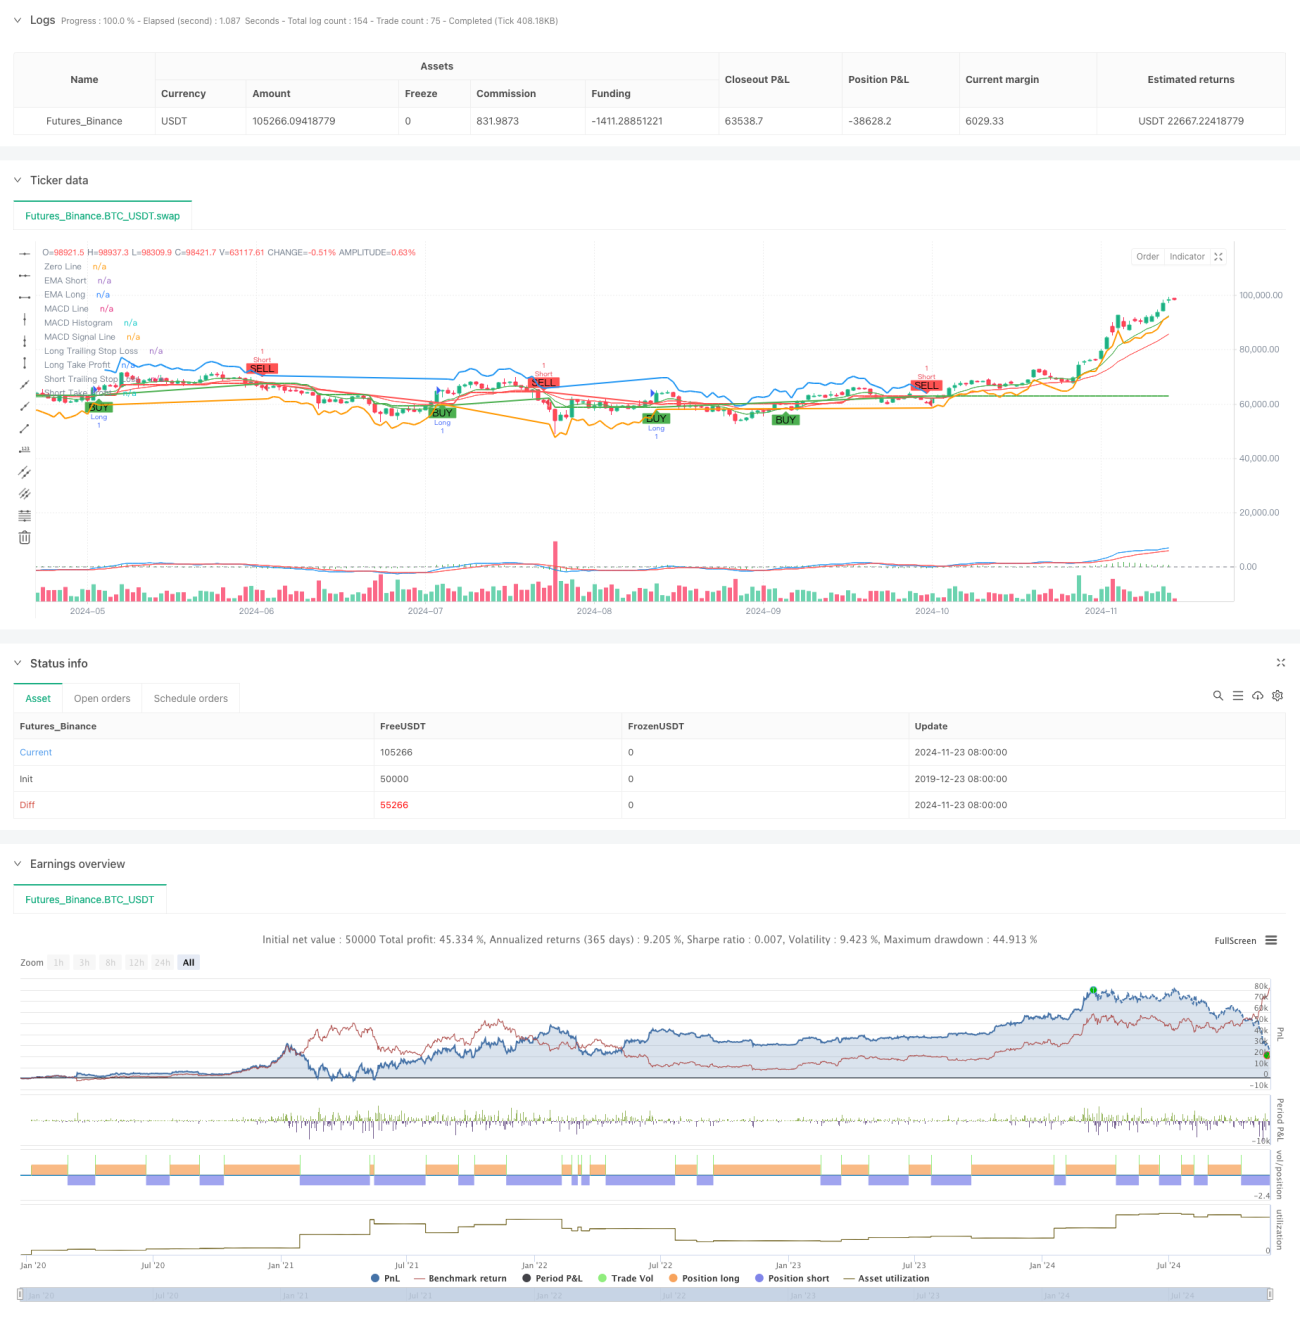
Ringkasan
Strategi ini adalah sistem perdagangan tren yang komprehensif, menggabungkan analisis multi-kerangka waktu, sistem rata-rata bergerak, indikator momentum, dan indikator volatilitas. Sistem ini mengidentifikasi arah tren melalui persilangan Exponential Moving Average (EMA) jangka pendek dan jangka panjang, menggunakan Relative Strength Index (RSI) untuk menentukan kondisi overbought dan oversold, mengkonfirmasi momentum dengan MACD, dan menggunakan EMA kerangka waktu yang lebih tinggi sebagai filter tren. Sistem ini menggunakan stop loss dan take profit dinamis berdasarkan ATR yang dapat menyesuaikan diri secara adaptif terhadap volatilitas pasar.
Prinsip Strategi
Strategi menggunakan mekanisme verifikasi berlapis untuk pengambilan keputusan perdagangan:
- Lapisan Identifikasi Tren: menggunakan persilangan EMA periode 9 dan 21 untuk menangkap perubahan tren
- Lapisan Konfirmasi Momentum: memverifikasi momentum tren melalui persilangan dan arah indikator MACD (12, 26, 9)
- Filter Overbought/Oversold: menggunakan indikator RSI (14) pada level 70/30 sebagai filter
- Konfirmasi Kerangka Waktu Lebih Tinggi: secara opsional menggunakan EMA level harian sebagai filter tren
- Manajemen Risiko: menggunakan trailing stop 1,5 kali ATR dan target profit 2 kali ATR
Sistem hanya akan membuka posisi setelah beberapa kondisi terpenuhi: persilangan EMA, RSI tidak ekstrem, arah MACD benar, dan konfirmasi tren kerangka waktu lebih tinggi. Keluar posisi dilakukan dengan menggabungkan trailing stop dan target profit tetap.
Keunggulan Strategi
- Mekanisme verifikasi ganda secara signifikan mengurangi sinyal palsu
- Filter tren kerangka waktu lebih tinggi meningkatkan rasio kemenangan
- Stop loss dinamis berbasis volatilitas sangat adaptif
- Sistem manajemen risiko yang lengkap
- Parameter dapat disesuaikan secara fleksibel sesuai karakteristik pasar yang berbeda
- Mendukung perdagangan dua arah, dapat beradaptasi dengan lingkungan pasar yang berbeda
- Kombinasi indikator memperhatikan tren sekaligus momentum
Risiko Strategi
- Banyak kondisi dapat menyebabkan terlewatnya beberapa peluang perdagangan
- Mungkin sering melakukan perdagangan di pasar yang bergejolak (sideways)
- Optimasi parameter dapat menyebabkan overfitting
- Konfirmasi kerangka waktu lebih tinggi dapat menyebabkan keterlambatan masuk posisi
Solusi:
- Menyesuaikan parameter secara dinamis berdasarkan karakteristik pasar yang berbeda
- Meningkatkan fleksibilitas pemilihan arah perdagangan
- Memperkenalkan mekanisme filter volatilitas
- Mengoptimalkan mekanisme adaptasi parameter
Arah Optimasi Strategi
- Memperkenalkan mekanisme filter volatilitas, menyesuaikan posisi selama periode volatilitas tinggi
- Mengembangkan mekanisme adaptasi parameter, menyesuaikan secara dinamis berdasarkan kondisi pasar
- Menambahkan indikator volume untuk memvalidasi efektivitas sinyal
- Mengoptimalkan logika penentuan tren kerangka waktu lebih tinggi
- Menyempurnakan skema stop loss, pertimbangkan menambahkan time stop
- Mengembangkan modul evaluasi kinerja strategi
Kesimpulan
Strategi ini adalah sistem perdagangan tren yang lengkap, melalui kombinasi berbagai indikator teknis dan sistem manajemen risiko yang ketat, mampu memperoleh keuntungan yang stabil di pasar yang sedang tren. Sistem ini memiliki skalabilitas yang kuat, melalui optimasi dapat beradaptasi dengan lingkungan pasar yang berbeda. Disarankan untuk melakukan backtest dan optimasi parameter yang memadai sebelum melakukan perdagangan langsung (real trading).
- 1