
Ringkasan
Strategi ini adalah sistem perdagangan kuantitatif yang menggabungkan Bollinger Bands, Relatively Strong Indicator (RSI) dan Dynamic Cost Average (DCA). Strategi ini menggunakan aturan manajemen dana untuk melakukan operasi posisi secara otomatis dalam fluktuasi pasar, sekaligus melakukan penilaian sinyal jual beli dalam kombinasi dengan indikator teknis, untuk melakukan transaksi yang dapat dikontrol risiko. Sistem ini juga menyertakan logika stop-loss dan fitur pelacakan keuntungan kumulatif, yang dapat secara efektif memantau dan mengelola kinerja perdagangan.
Prinsip Strategi
Strategi ini terutama didasarkan pada komponen inti berikut:
- Indikator Brin-Band digunakan untuk menentukan kisaran fluktuasi harga, mempertimbangkan untuk membeli ketika harga menyentuh rel bawah, mempertimbangkan untuk menjual ketika menyentuh rel atas
- Indikator RSI digunakan untuk mengkonfirmasi pasar overbought dan oversold, RSI di bawah 25 mengkonfirmasi oversold, di atas 75 mengkonfirmasi oversold
- Modul DCA mengkalkulasi jumlah setiap kali Anda membuat posisi berdasarkan dinamika hak dan kepentingan akun, untuk mengimplementasikan manajemen adaptif dana
- Modul Stop-loss menetapkan target keuntungan 5%, mencapai target keuntungan perlindungan posisi kosong otomatis
- Modul pemantauan kondisi pasar menghitung perubahan pasar selama 90 hari untuk membantu menentukan tren keseluruhan
- Modul pelacakan keuntungan akumulasi mencatat kerugian dan kerugian dari setiap transaksi untuk membantu menilai kinerja strategi
Keunggulan Strategis
- Meningkatkan reliabilitas sinyal dengan cross-validasi multi-indikator teknis
- Mengadopsi manajemen posisi dinamis untuk menghindari risiko dari posisi tetap
- Menetapkan kondisi stop loss yang wajar dan mengunci keuntungan tepat waktu
- Dengan fitur pemantauan tren pasar, Anda dapat mengamati situasi secara keseluruhan.
- Sistem pelacakan keuntungan yang baik untuk menganalisis kinerja strategi
- Fitur peringatan yang lengkap, mengingatkan peluang perdagangan secara real time
Risiko Strategis
- Pasar yang bergejolak dapat sering memicu sinyal yang menyebabkan peningkatan biaya transaksi.
- Indeks RSI mungkin tertinggal di pasar tren
- Stopper Persentase Tetap Mungkin Keluar Lebih Awal di Pasar Berkecenderungan
- Strategi DCA di pasar yang turun secara sepihak dapat menyebabkan penurunan yang lebih besar
Langkah-langkah berikut direkomendasikan untuk mengelola risiko:
- Tetapkan batas maksimum
- Parameter yang disesuaikan dengan dinamika fluktuasi pasar
- Tambahkan filter tren
- Menerapkan strategi penghentian bertahap
Arah optimasi strategi
- Optimasi dinamis parameter:
- Parameter pita Brin dapat disesuaikan dengan fluktuasi
- RSI terendah dapat berubah seiring siklus pasar
- Proporsi dana DCA dapat disesuaikan dengan ukuran akun
- Sistem sinyal diperkuat:
- Konfirmasi peningkatan volume
- Menambahkan analisis garis tren
- Tergabung dengan lebih banyak indikator teknis cross-verifikasi
- Pengendalian risiko:
- Membuat Stop Loss Dinamis
- Tambahkan kontrol mundur maksimum
- Tetapkan batas kerugian harian
Meringkaskan
Strategi ini membangun sistem perdagangan yang lebih lengkap dengan menggunakan analisis teknis dan metode manajemen dana secara komprehensif. Strategi ini memiliki keunggulan dalam pengakuan sinyal ganda dan manajemen risiko yang baik, tetapi masih perlu diuji dan dioptimalkan secara menyeluruh di pasar. Dengan terus meningkatkan pengaturan parameter dan menambahkan indikator tambahan, strategi ini diharapkan untuk mencapai kinerja yang stabil dalam perdagangan nyata.
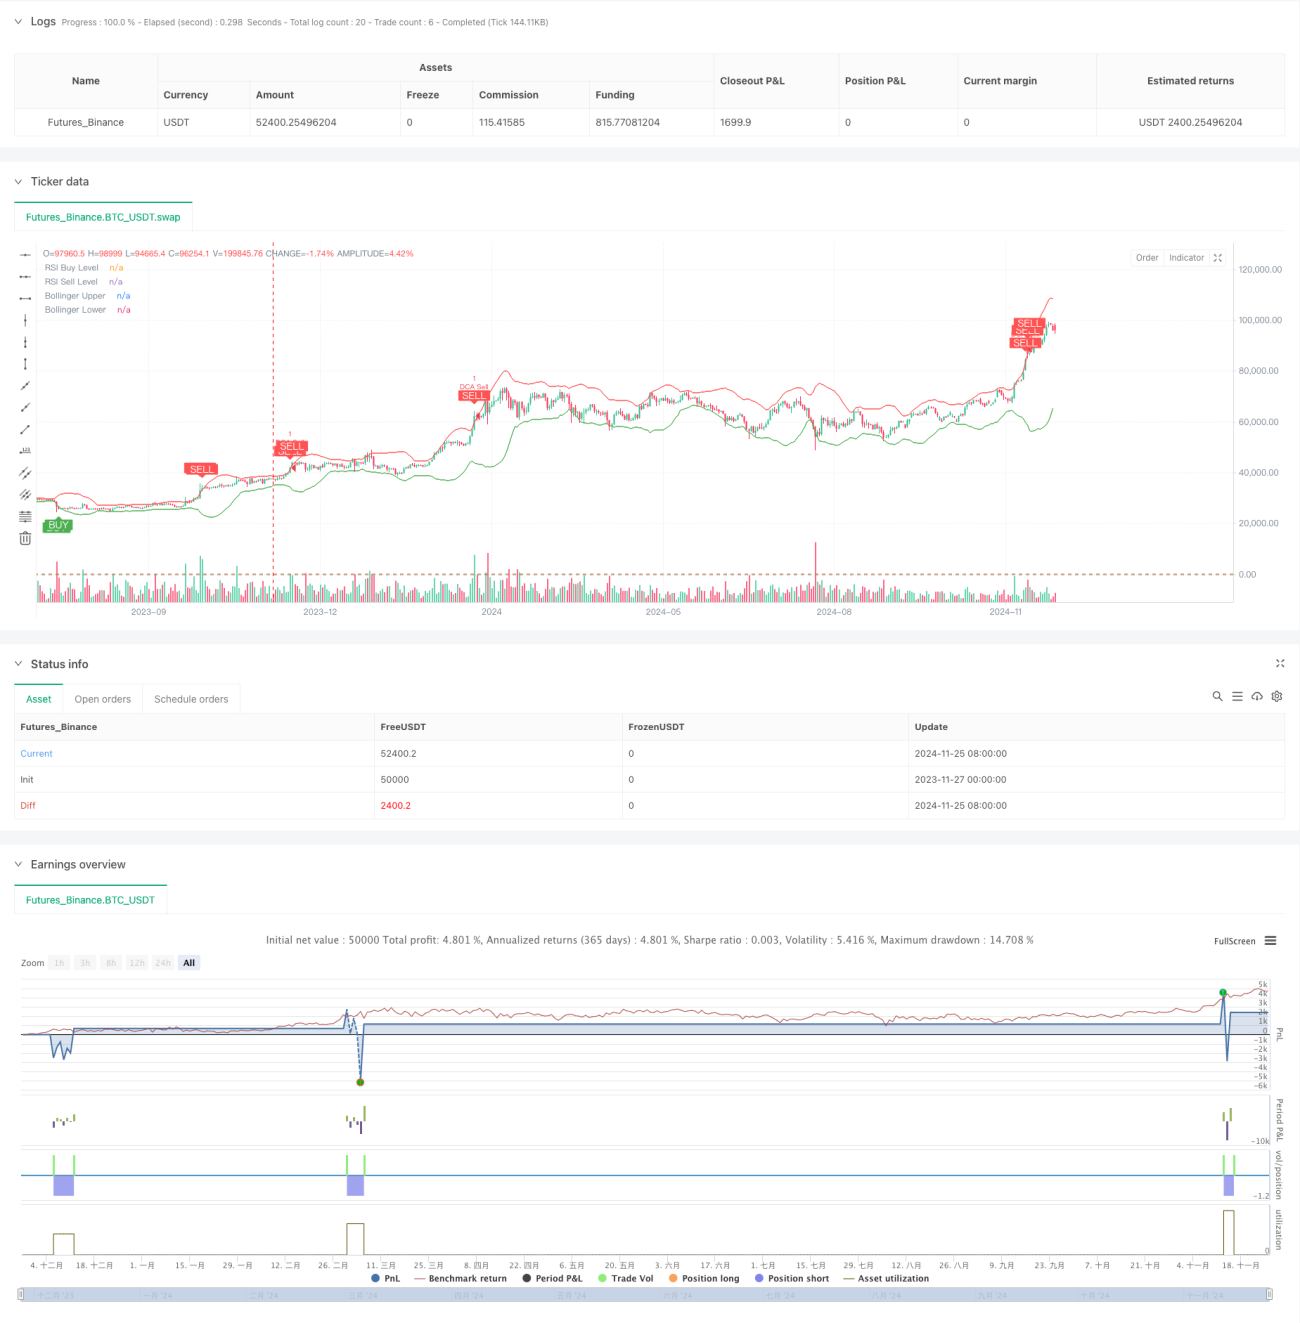
/*backtest
start: 2023-11-27 00:00:00
end: 2024-11-26 00:00:00
period: 1d
basePeriod: 1d
exchanges: [{"eid":"Futures_Binance","currency":"BTC_USDT"}]
*/

//@version=5
strategy("Combined BB RSI with Cumulative Profit, Market Change, and Futures Strategy (DCA)", shorttitle="BB RSI Combined DCA Strategy", overlay=true)

// Input Parameters- 1