Pelacakan tren silang multi-indikator dan strategi perdagangan adaptif yang menggabungkan volume dan harga

Ringkasan
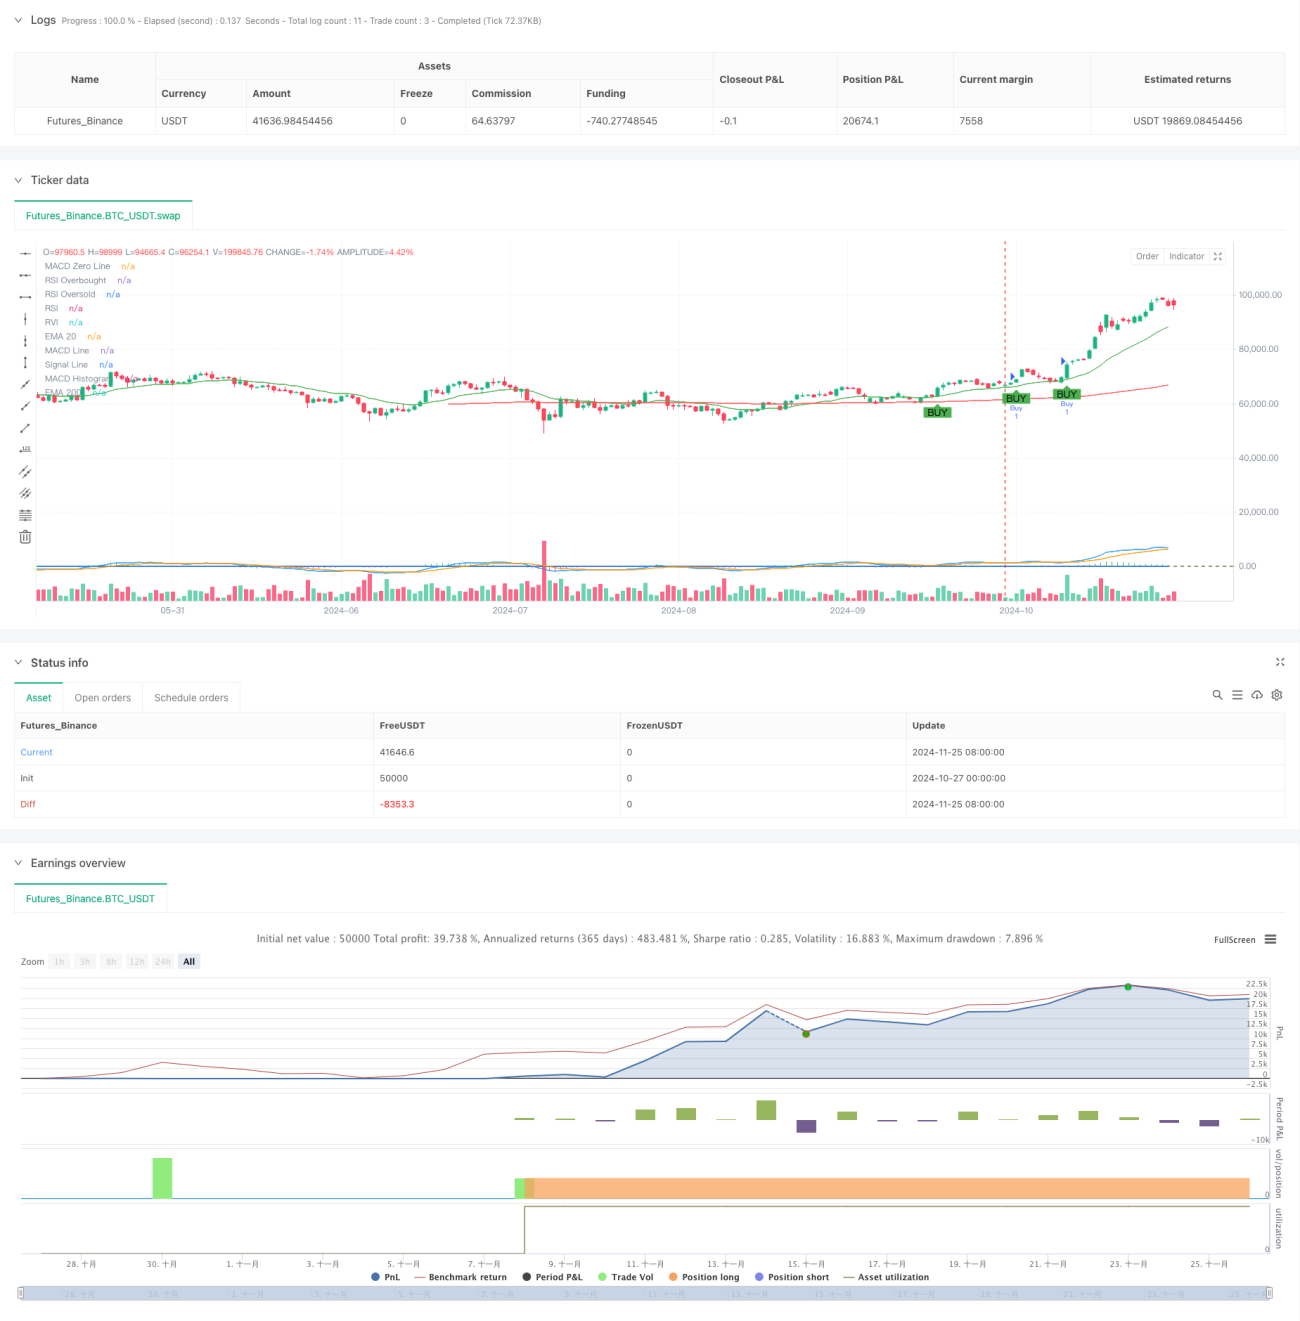
Strategi ini adalah sistem perdagangan pelacakan tren yang menggabungkan beberapa indikator teknis untuk mengidentifikasi tren pasar melalui sinyal silang indikator seperti MACD, RSI, RVI, EMA, dan konfirmasi volume, dan menggunakan pelacakan stop loss untuk mengelola risiko. Strategi ini beroperasi dalam kisaran harga tertentu untuk meningkatkan akurasi dan keandalan perdagangan dengan penilaian komprehensif dari beberapa sinyal.
Prinsip Strategi
Strategi ini menggunakan mekanisme verifikasi sinyal bertingkat, yang terdiri dari beberapa komponen utama: pertama, menggunakan indeks moving average (EMA) selama 20 siklus dan 200 siklus untuk menentukan tren pasar secara keseluruhan; kedua, menggunakan MACD indicator (RSI) untuk menangkap titik-titik perubahan tren; ketiga, menggunakan indikator relatif kuat (RSI) dan indikator relatif berfluktuasi (RVI) untuk mengkonfirmasi status overbought dan oversold pasar; dan terakhir, melakukan konfirmasi perdagangan melalui indikator transaksi.
Keunggulan Strategis
- Sistem verifikasi sinyal ganda secara signifikan mengurangi risiko penembakan palsu
- Kombinasi dari trend tracking dan indikator getaran, mampu menjaga stabilitas dalam berbagai kondisi pasar
- Meningkatkan keandalan sinyal transaksi dengan mengkonfirmasi volume transaksi
- Tracking Stop Loss Mechanism dapat secara efektif melindungi keuntungan yang telah diperoleh
- Pembatasan kisaran harga dapat mencegah overtrading dalam situasi ekstrem
- Parameter indikator dapat disesuaikan secara fleksibel dengan kondisi pasar
- Sistem memiliki skalabilitas dan kemampuan beradaptasi yang baik
Risiko Strategis
- Kondisi ganda dapat menyebabkan kehilangan peluang perdagangan yang penting
- Sinyal-sinyal palsu yang mungkin sering terjadi di pasar yang bergoyang
- Pembatasan pada kisaran harga tetap dapat membuat strategi kehilangan peluang untuk terobosan penting.
- Terlalu mengandalkan indikator teknis dapat mengabaikan dampak dari faktor-faktor mendasar
- Tracking stop loss dapat dipicu terlalu dini pada saat volatilitas tinggi
Arah optimasi strategi
- Memperkenalkan mekanisme parameter adaptif untuk menyesuaikan parameter masing-masing indikator sesuai dengan dinamika fluktuasi pasar
- Menambahkan indikator sentimen pasar, meningkatkan kemampuan untuk menilai titik balik pasar
- Mengembangkan mekanisme penilaian harga yang dinamis untuk membuat strategi lebih fleksibel
- Menambahkan filter siklus waktu untuk menghindari perdagangan pada saat yang tidak menguntungkan
- Optimalkan mekanisme stop loss, pertimbangkan untuk memperkenalkan stop loss dinamis berdasarkan volatilitas
- Menambahkan modul manajemen risiko untuk manajemen posisi yang lebih baik
Meringkaskan
Strategi ini menggunakan kombinasi dari beberapa indikator teknis untuk membangun sistem perdagangan yang relatif lengkap. Meskipun ada beberapa keterbatasan, strategi ini memiliki nilai praktis yang baik melalui optimasi parameter yang masuk akal dan manajemen risiko. Di masa depan, strategi ini dapat meningkatkan stabilitas dan profitabilitas dengan memperkenalkan lebih banyak mekanisme adaptasi dan pengendalian risiko.
- 1