
Ringkasan
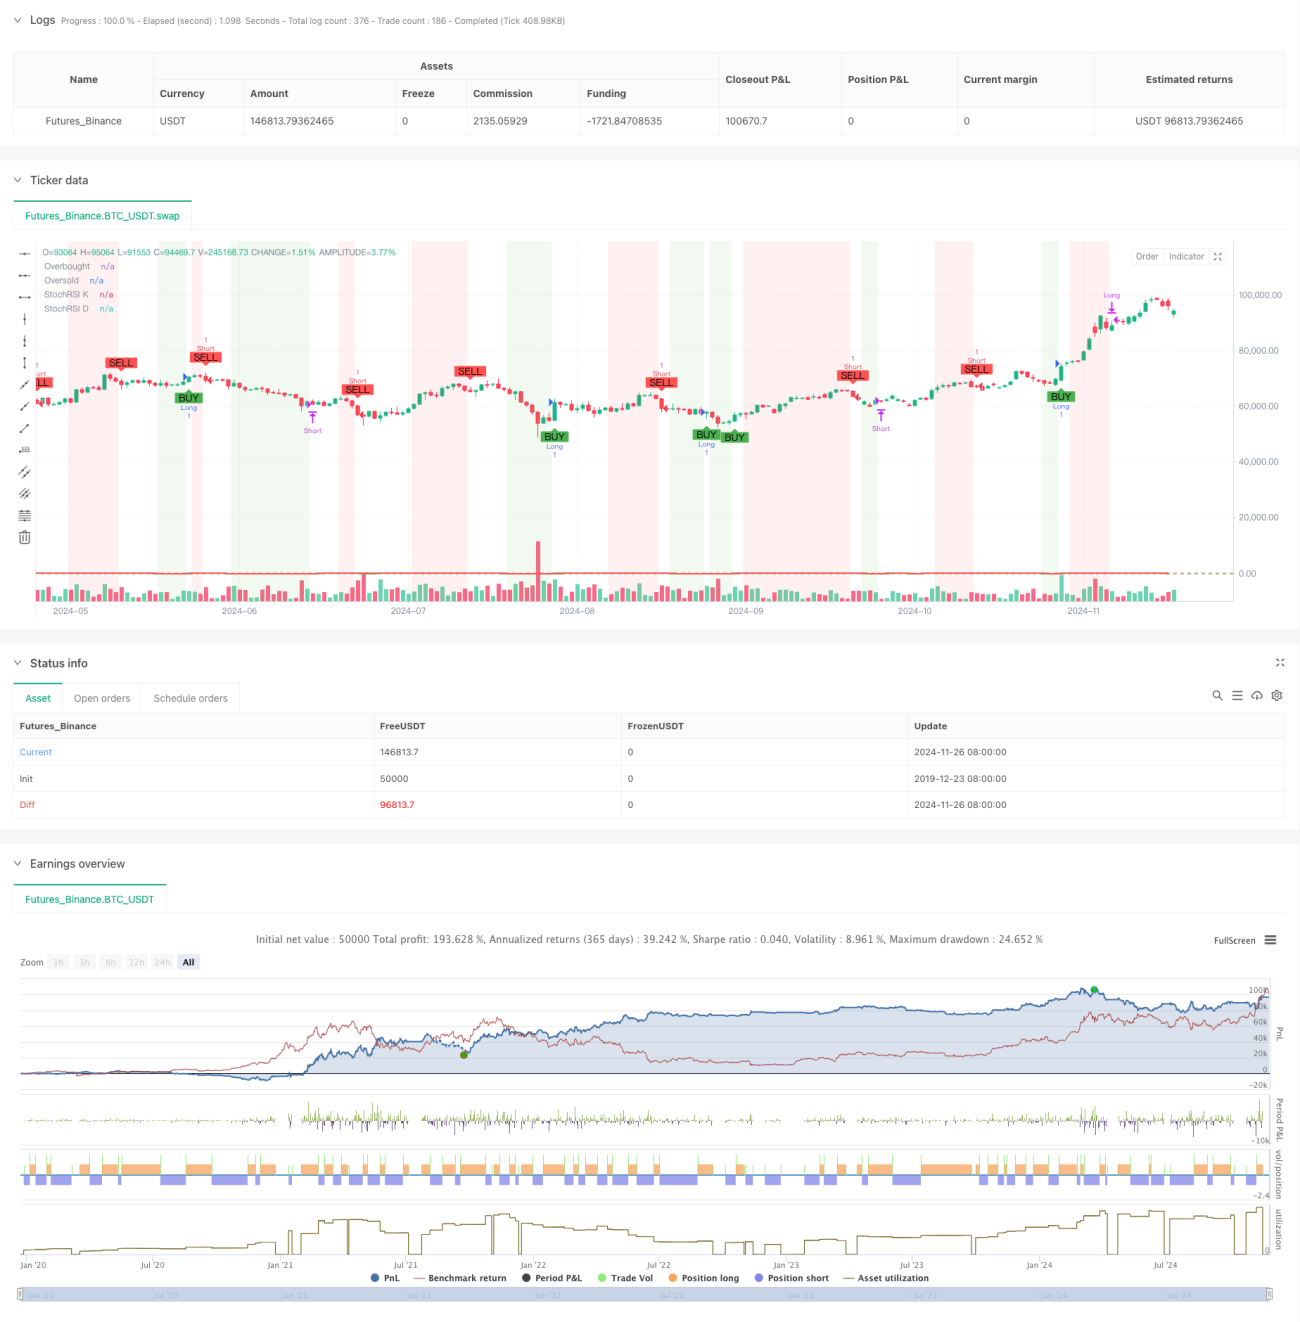
Strategi ini adalah sistem perdagangan kompleks yang menggabungkan indeks yang relatif kuat secara acak (Stochastic RSI) dan bentuk grafik. Sistem ini mengkonfirmasi grafik pergerakan harga dengan menganalisis tingkat overbought dan oversold dari indikator SRSI, untuk menghasilkan sinyal perdagangan yang sepenuhnya otomatis. Strategi ini menggunakan metode kombinasi indikator teknis yang canggih, menggabungkan fitur pelacakan tren dan perdagangan reversal, dan memiliki kemampuan beradaptasi pasar yang kuat.
Prinsip Strategi
Logika inti dari strategi ini didasarkan pada elemen-elemen kunci berikut:
- Menggunakan RSI 14 siklus sebagai dasar, menghitung nilai RSI acak, membentuk sumber sinyal utama
- Siapkan garis K dan garis D dari RSI acak sebagai rata-rata bergerak sederhana 3 periode untuk sinyal smoothing
- Menetapkan 80 dan 20 sebagai nilai kritis overbought dan oversold untuk menilai kondisi pasar
- Hubungan antara harga pembukaan dan harga penutupan dari grafik saat ini untuk mengkonfirmasi arah pergerakan pasar
- Ketika garis K melintasi level oversold ke atas dan muncul sinar matahari, memicu sinyal multipel
- Ketika K-line turun melewati level overbought dan muncul garis negatif, memicu sinyal kosong
- Stop loss di arah yang sesuai saat melewati level overbought dan oversold pada garis K.
Keunggulan Strategis
- Reliabilitas sinyal yang tinggi: Akurasi sinyal perdagangan ditingkatkan secara signifikan melalui RSI acak dan mekanisme konfirmasi ganda grafik
- Kendali risiko yang baik: kondisi stop loss yang jelas diatur untuk mengontrol risiko setiap transaksi secara efektif
- Parameter yang dapat disesuaikan: parameter kunci dapat disesuaikan secara optimal sesuai dengan karakteristik pasar yang berbeda
- Umpan balik visual yang jelas: menggunakan warna latar belakang dan penanda grafis untuk menampilkan sinyal perdagangan secara intuitif
- Tingkat otomatisasi yang tinggi: otomatisasi seluruh proses, mulai dari pembuatan sinyal hingga eksekusi pesanan, mengurangi intervensi manusia
Risiko Strategis
- Risiko pasar bergoyang: Sering terjadi sinyal palsu di pasar bergoyang
- Risiko keterbelakangan: Penghitungan rata-rata bergerak memiliki keterbelakangan dan mungkin melewatkan titik masuk terbaik
- Sensitivitas parameter: pengaturan parameter yang berbeda secara signifikan mempengaruhi kinerja strategi dan perlu terus dioptimalkan
- Ketergantungan pada kondisi pasar: sinyal mungkin tidak cukup stabil dalam kondisi pasar yang sangat bergejolak
- Risiko sistemik: pengaturan stop loss dapat gagal ketika terjadi peristiwa besar di pasar
Arah optimasi strategi
- Memperkenalkan indikator volume transaksi: dapat meningkatkan volume transaksi sebagai syarat tambahan untuk konfirmasi sinyal
- Optimalkan mekanisme stop loss: Anda dapat mempertimbangkan untuk menggunakan tracking stop loss atau stop loss dinamis ATR
- Tambahkan filter tren: Tambahkan rata-rata bergerak periode panjang sebagai filter tren
- Filter sinyal yang lebih baik: pertimbangkan volatilitas pasar dan sesuaikan parameter jika volatilitasnya tinggi
- Penyesuaian parameter dinamis: penyesuaian dinamis berdasarkan kondisi pasar
Meringkaskan
Strategi ini membangun sistem perdagangan yang kuat dengan menggabungkan indikator RSI acak dan bentuk grafik. Sistem ini memiliki kontrol risiko yang baik, sementara tetap sederhana. Strategi ini dapat beradaptasi dengan lingkungan pasar yang berbeda dengan pengoptimalan parameter dan pemfilteran sinyal yang masuk akal.
- 1