
Ringkasan
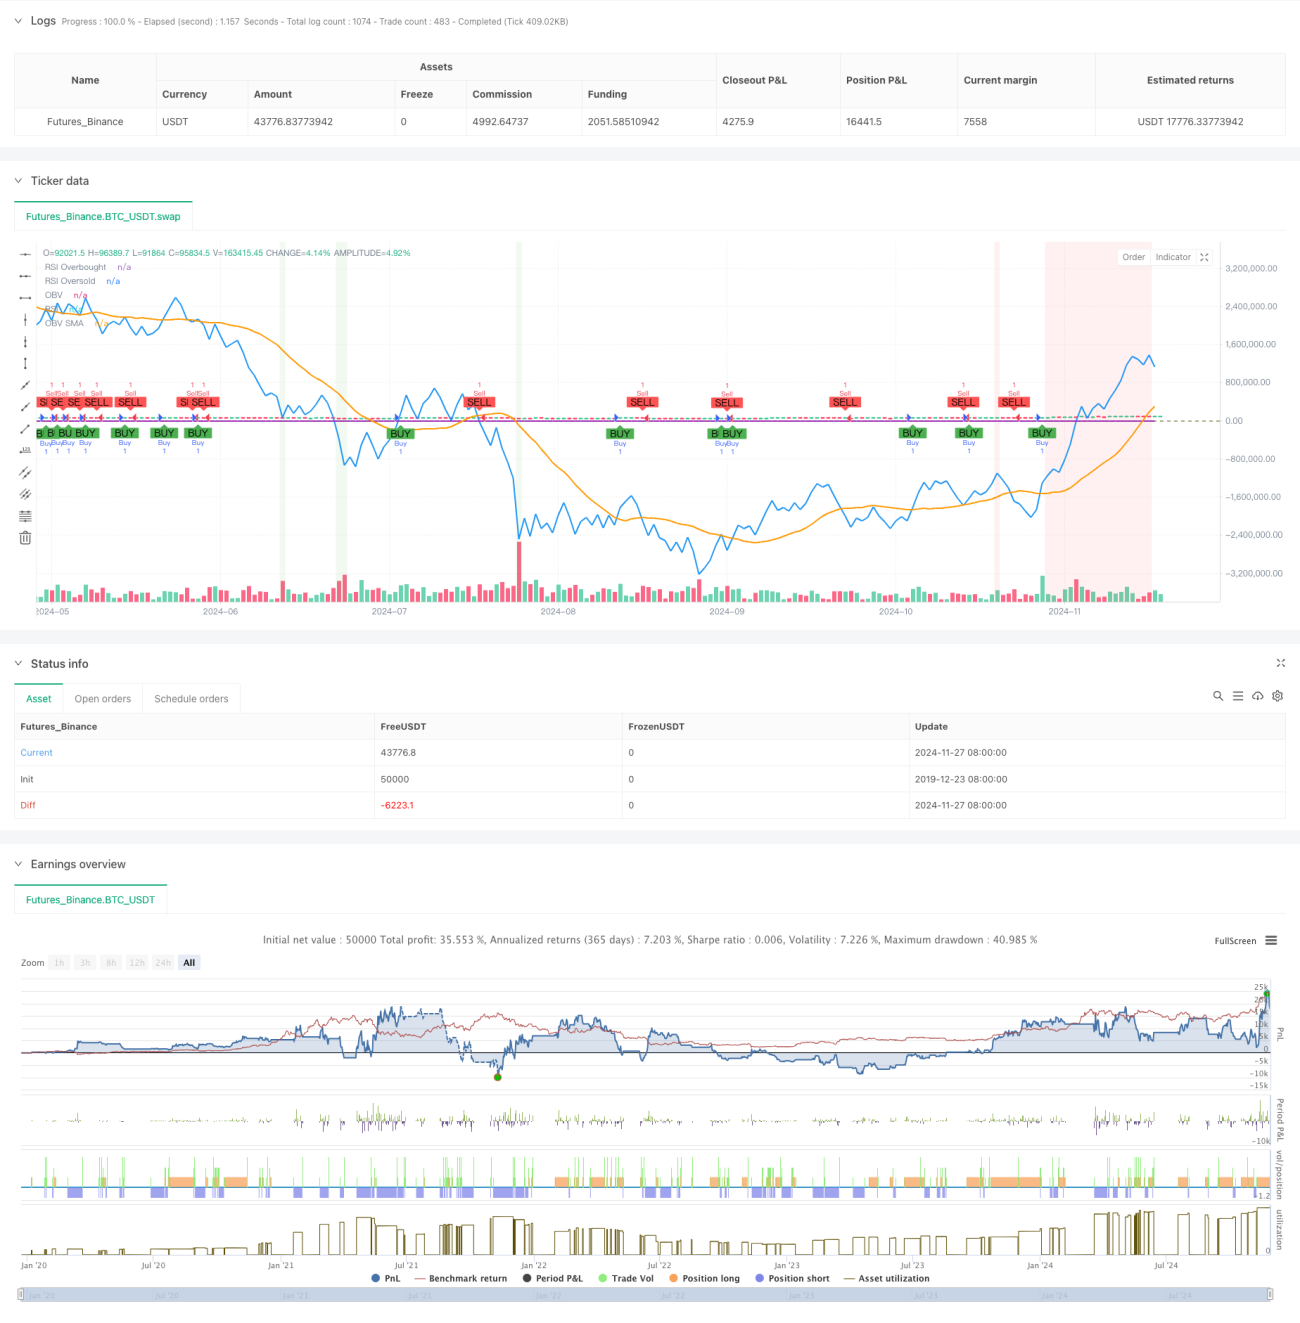
Strategi ini adalah sistem perdagangan momentum multi-dimensi yang menggabungkan indikator energi berimbang (OBV), moving average (SMA) dan indikator relatif lemah (RSI). Strategi ini menangkap pergerakan pasar dengan memantau sinyal silang OBV dan moving average-nya, sambil menggunakan RSI untuk memfilter dan secara efektif menghindari penangkapan yang berlebihan. Strategi ini juga mengintegrasikan persentase stop loss dan mekanisme profit and loss, yang memungkinkan manajemen keseimbangan risiko dan keuntungan.
Prinsip Strategi
Logika inti dari strategi ini didasarkan pada tiga dimensi:
- Indikator OBV digunakan untuk mengukur sentimen pasar dari jumlah transaksi yang terakumulasi, dengan menghitung arah perubahan harga dan jumlah transaksi yang terakumulasi untuk mencerminkan kekuatan jual beli pasar.
- OBV 20 Periode Moving Average sebagai baseline, ketika OBV naik melewati Moving Average dan RSI lebih rendah dari 70, memicu sinyal plus; ketika OBV turun melewati Moving Average dan RSI lebih tinggi dari 30, memicu sinyal kosong.
- RSI diperkenalkan sebagai filter untuk mencegah overbought dan oversold, dan mengurangi risiko false breakout.
Strategi ini menggunakan persentase tetap dari stop loss (<2%) dan target profit (<4%), dan kerangka manajemen risiko yang simetris ini membantu mempertahankan rasio risiko-penghasilan yang stabil.
Keunggulan Strategis
- Mekanisme pengesahan sinyal multidimensi mengurangi dampak sinyal palsu
- Menggabungkan volume transaksi, dinamika harga, dan indikator overbought dan oversold secara organik
- Kerangka kerja manajemen risiko yang jelas, target stop loss dan profit yang tetap
- Strategi logis sederhana dan jelas, mudah dipahami dan dipertahankan
- Desain visual yang bagus, sinyal perdagangan dan indikator yang jelas
Risiko Strategis
- Stop loss yang mungkin sering terjadi di pasar yang bergejolak
- Stop loss persentase tetap mungkin tidak cocok untuk semua kondisi pasar
- Kondisi penyaringan RSI mungkin melewatkan beberapa titik awal tren penting
- Indikator OBV dapat menghasilkan sinyal yang menyesatkan dalam lingkungan likuiditas rendah
- Strategi tidak mempertimbangkan dampak dari karakteristik siklus pasar
Arah optimasi strategi
- Memperkenalkan mekanisme penutupan yang disesuaikan, seperti penutupan ATR atau penutupan yang disesuaikan dengan volatilitas
- Menambahkan filter tren, seperti garis rata-rata jangka panjang untuk menentukan arah tren utama
- Optimalkan parameter RSI, pertimbangkan perubahan dinamika dari overbought dan oversold
- Tambahkan kondisi penyaringan volume transaksi untuk memastikan sinyal dipicu di bawah dukungan volume transaksi yang efektif
- Pertimbangkan untuk memasukkan filter waktu untuk menghindari periode yang sangat fluktuatif
- Menambahkan mekanisme manajemen posisi, untuk melakukan penyesuaian posisi secara dinamis
Meringkaskan
Ini adalah strategi perdagangan dinamis multi-dimensi yang dirancang dengan baik, dengan menggabungkan keunggulan indikator teknis, untuk membangun sistem perdagangan yang lengkap. Keunggulan inti dari strategi ini adalah mekanisme pengakuan sinyal multi-lapisan dan kerangka manajemen risiko yang diatur. Meskipun ada beberapa risiko potensial, strategi ini dapat ditingkatkan lebih lanjut dengan orientasi optimasi yang disarankan.
- 1