Strategi Heikin-Ashi yang dihaluskan dikombinasikan dengan strategi mengikuti tren persilangan SMA

Ringkasan
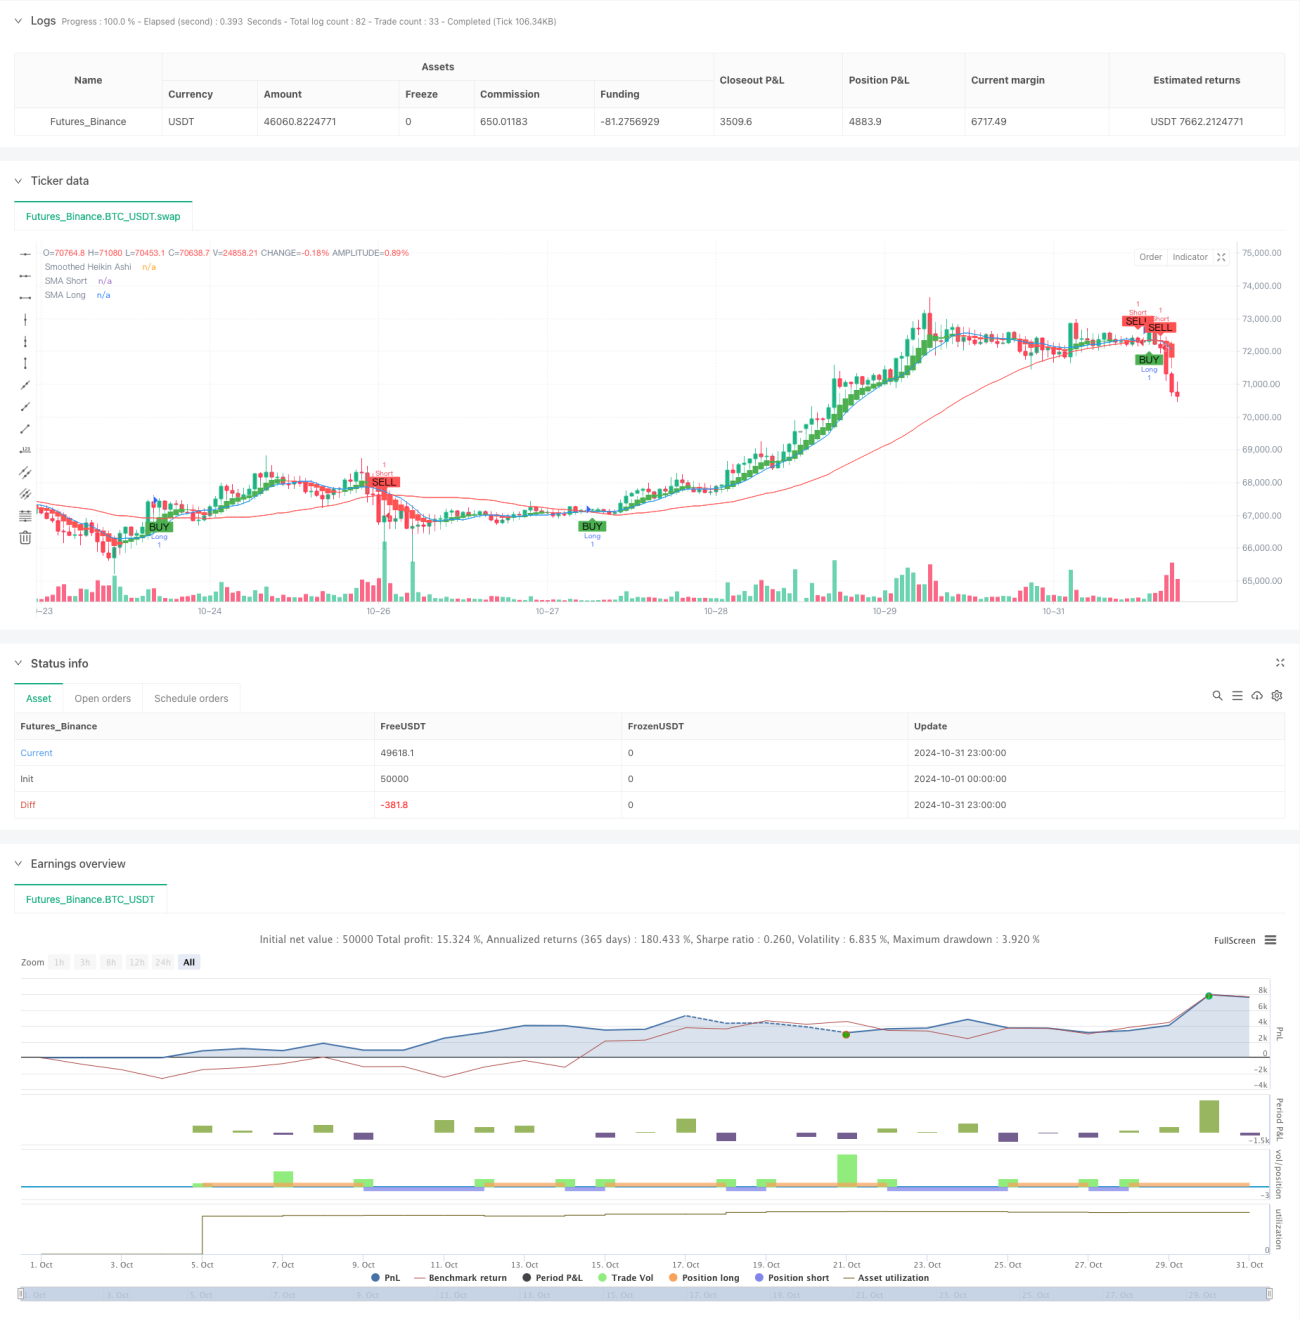
Strategi ini adalah sistem pelacakan tren yang didasarkan pada Heikin-Ashi chart yang diluruskan dan crossover SMA. Strategi ini mengidentifikasi perubahan tren melalui Heikin-Ashi chart setelah EMA diluruskan dan crossover SMA periode 44, sehingga menangkap peluang tren utama di pasar. Strategi ini merancang mekanisme manajemen posisi yang dinamis, yang secara otomatis melangsungkan posisi ketika harga dekat dengan garis rata-rata jangka panjang, untuk menghindari risiko gejolak di seluruh pasar.
Prinsip Strategi
Logika inti dari strategi ini terdiri dari tiga elemen kunci: pertama adalah mengubah garis K tradisional ke dalam grafik Heikin-Ashi, untuk menyaring kebisingan pasar dengan menghitung rata-rata aritmatika dari empat harga harga tinggi dan rendah; kedua, menggunakan 6 siklus EMA untuk pengolahan halus Heikin-Ashi, untuk meningkatkan keandalan sinyal lebih lanjut; dan terakhir, menggabungkan harga penutupan Heikin-Ashi setelah perataan dengan 44 siklus SMA, untuk menghasilkan sinyal melakukan lebih banyak melalui atas, untuk menghasilkan sinyal kosong melalui bawah.
Keunggulan Strategis
- Mekanisme penyaringan sinyal yang disempurnakan, mengurangi kemungkinan penembusan palsu secara signifikan melalui Heikin-Ashi dan EMA ganda
- Logika pelacakan tren yang jelas dan efektif untuk menangkap tren besar
- Mekanisme stop loss yang dirancang secara dinamis untuk berangkat tepat waktu saat melakukan penyusunan horizontal.
- Pengaturan parameter masuk akal, perbandingan antara siklus 11 garis rata-rata jangka pendek dan siklus 44 garis rata-rata jangka panjang sesuai dengan hukum operasi pasar
- Efek visualisasi yang bagus, sinyal perdagangan yang jelas dan intuitif
Risiko Strategis
- Pada awal pergeseran tren mungkin ada beberapa keterlambatan, yang menyebabkan sedikit penundaan waktu masuk.
- Dalam situasi pasar yang sangat bergejolak, sinyal silang palsu dapat dihasilkan.
- Sensitif terhadap pengaturan parameter, varietas yang berbeda mungkin memerlukan penyesuaian khusus
- Perdagangan sering terjadi di pasar yang tidak memiliki tren yang jelas
Arah optimasi strategi
- Saran untuk menambahkan filter kekuatan tren, seperti indikator ADX, dan hanya mengambil posisi saat tren jelas
- Mekanisme pengesahan transaksi yang dapat diintegrasikan dengan kuantitas dan harga untuk meningkatkan keandalan sinyal
- Pertimbangkan untuk memasukkan mekanisme anti-slip point untuk menghindari sering berdagang di dekat harga penting.
- Anda dapat merancang mekanisme stop loss yang dinamis, yang secara otomatis menyesuaikan dengan fluktuasi pasar.
- Disarankan untuk menambahkan modul manajemen posisi, menyesuaikan rasio kepemilikan posisi secara dinamis sesuai dengan intensitas tren
Meringkaskan
Strategi ini, dengan menggabungkan grafik Heikin-Ashi dan sistem garis rata SMA, membangun sistem perdagangan pelacakan tren yang solid. Mekanisme pembuatan sinyal strategi ini sempurna, kontrol risiko masuk akal, dan sangat cocok untuk digunakan di pasar dengan karakteristik tren yang jelas.
- 1