
Ringkasan
Strategi ini adalah sistem perdagangan cerdas yang menggabungkan MACD (Moving Average Convergence Spread Index) dan LRS (Linear Regression Slip Index). Strategi ini mengoptimalkan perhitungan MACD dengan kombinasi berbagai metode moving average, dan memperkenalkan analisis regresi linier untuk meningkatkan keandalan sinyal perdagangan. Strategi ini memungkinkan pedagang untuk memilih secara fleksibel menggunakan indikator tunggal atau kombinasi indikator ganda untuk menghasilkan sinyal perdagangan, dan dilengkapi dengan mekanisme stop loss untuk mengendalikan risiko.
Prinsip Strategi
Inti dari strategi ini adalah untuk menangkap tren pasar melalui MACD yang dioptimalkan dan indikator regresi linier. Bagian MACD menggunakan kombinasi dari empat metode moving average, SMA, EMA, WMA, dan TEMA, meningkatkan sensitivitas terhadap tren harga. Bagian regresi linier menilai arah dan intensitas tren dengan menghitung kemiringan dan lokasi garis regresi.
Keunggulan Strategis
- Fleksibilitas dalam kombinasi indikator: Anda dapat memilih untuk menggunakan kombinasi indikator tunggal atau ganda sesuai dengan kondisi pasar
- Perhitungan MACD yang disempurnakan: meningkatkan akurasi pengidentifikasian tren melalui berbagai metode moving average
- Konfirmasi tren obyektif: menggunakan regresi linier untuk memberikan penilaian tren yang didukung oleh statistik matematika
- Manajemen risiko yang lebih baik: Sistem Stop Loss Terintegrasi
- Parameter yang dapat disesuaikan: parameter kunci dapat dioptimalkan sesuai dengan karakteristik pasar yang berbeda
Risiko Strategis
- Sensitivitas parameter: mungkin perlu sering menyesuaikan parameter dalam berbagai kondisi pasar
- Penundaan sinyal: Ada keterlambatan dalam indikator kelas rata-rata bergerak
- Pasar bergoyang tidak berlaku: di pasar bergoyang horizontal dapat menghasilkan sinyal palsu
- Biaya peluang dari verifikasi ganda: verifikasi ganda yang ketat dapat melewatkan beberapa peluang perdagangan yang baik
Arah optimasi strategi
- Meningkatkan identifikasi kondisi pasar: memperkenalkan indikator volatilitas untuk membedakan pasar tren dan bergolak
- Pengaturan parameter dinamis: parameter MACD dan regresi linier yang secara otomatis disesuaikan dengan kondisi pasar
- Optimalkan Stop Loss: memperkenalkan Stop Loss Dinamis, yang secara otomatis menyesuaikan dengan fluktuasi pasar
- Meningkatkan analisis volume transaksi: menggabungkan indikator volume transaksi untuk meningkatkan kredibilitas sinyal
- Memperkenalkan analisis siklus waktu: mempertimbangkan konfirmasi siklus waktu ganda untuk meningkatkan akurasi transaksi
Meringkaskan
Strategi ini menciptakan sistem perdagangan yang memiliki fleksibilitas dan keandalan dengan menggabungkan versi yang lebih baik dari indikator klasik dan metode statistik. Desain modularnya memungkinkan pedagang untuk menyesuaikan parameter strategi dan mekanisme konfirmasi sinyal secara fleksibel sesuai dengan kondisi pasar yang berbeda. Dengan optimasi dan perbaikan berkelanjutan, strategi ini diharapkan untuk mempertahankan kinerja yang stabil di berbagai lingkungan pasar.
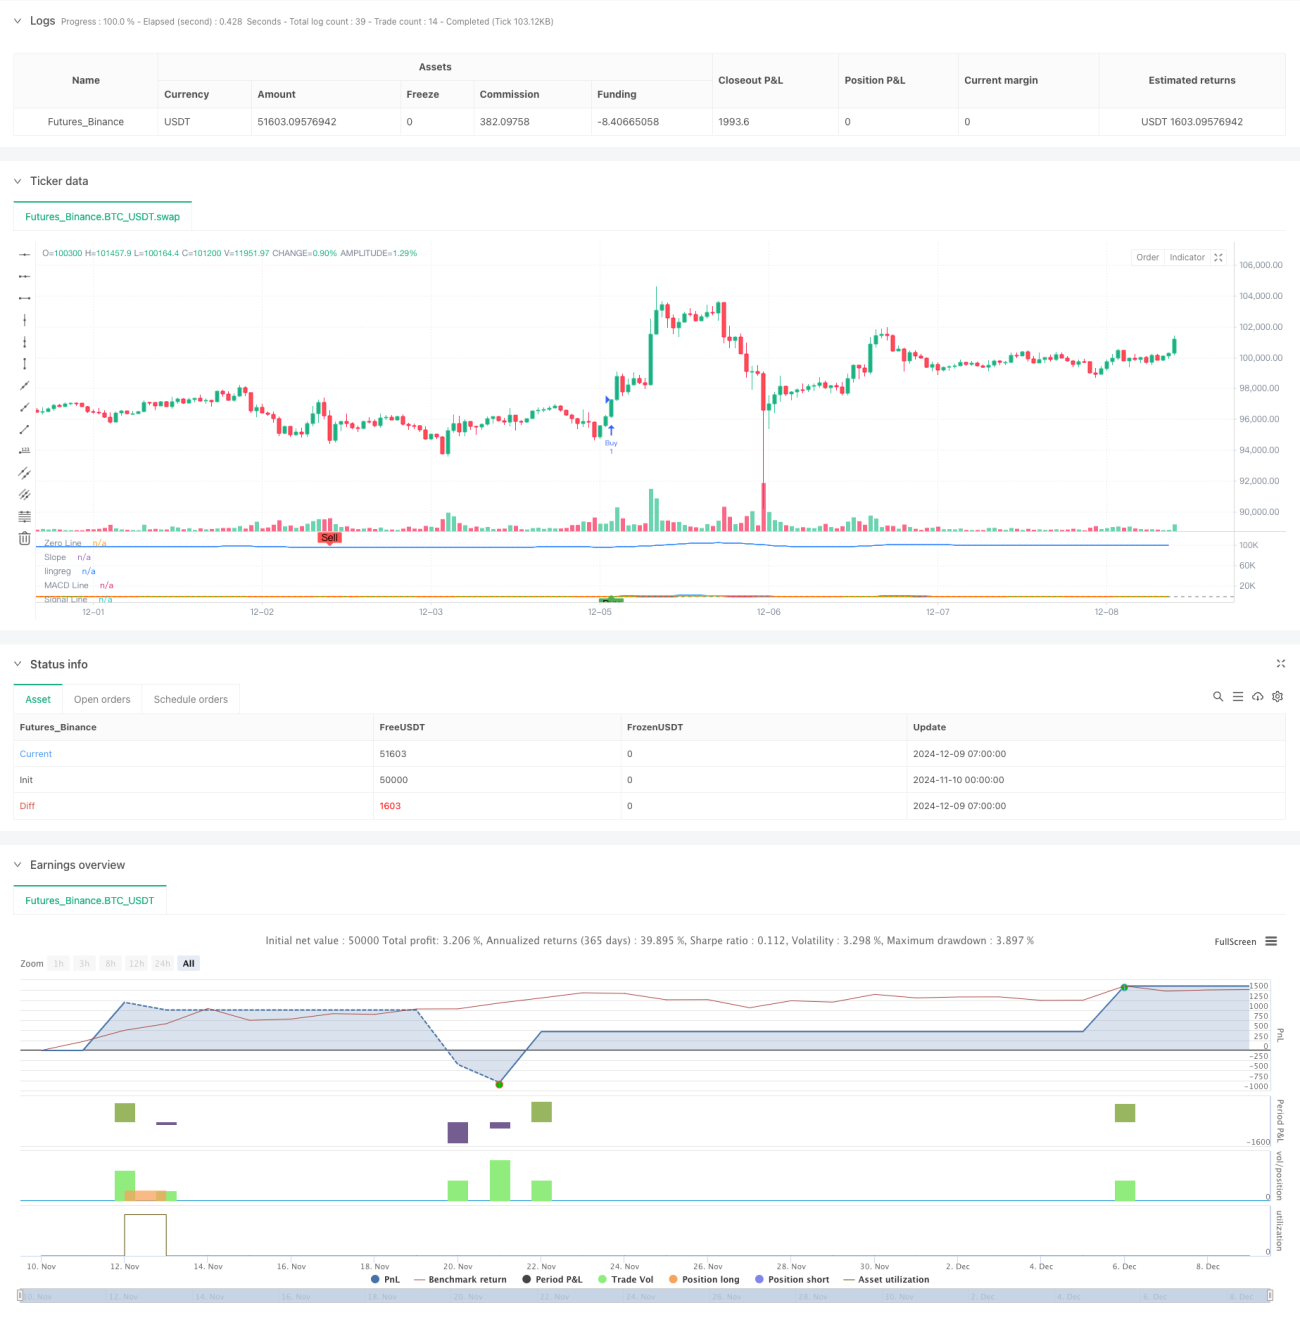
/*backtest
start: 2024-11-10 00:00:00
end: 2024-12-09 08:00:00
period: 1h
basePeriod: 1h
exchanges: [{"eid":"Futures_Binance","currency":"BTC_USDT"}]
*/

//@version=6
strategy('SIMPLIFIED MACD & LRS Backtest by NHBProd', overlay=false)

// Function to calculate TEMA (Triple Exponential Moving Average)- 1