
Ringkasan
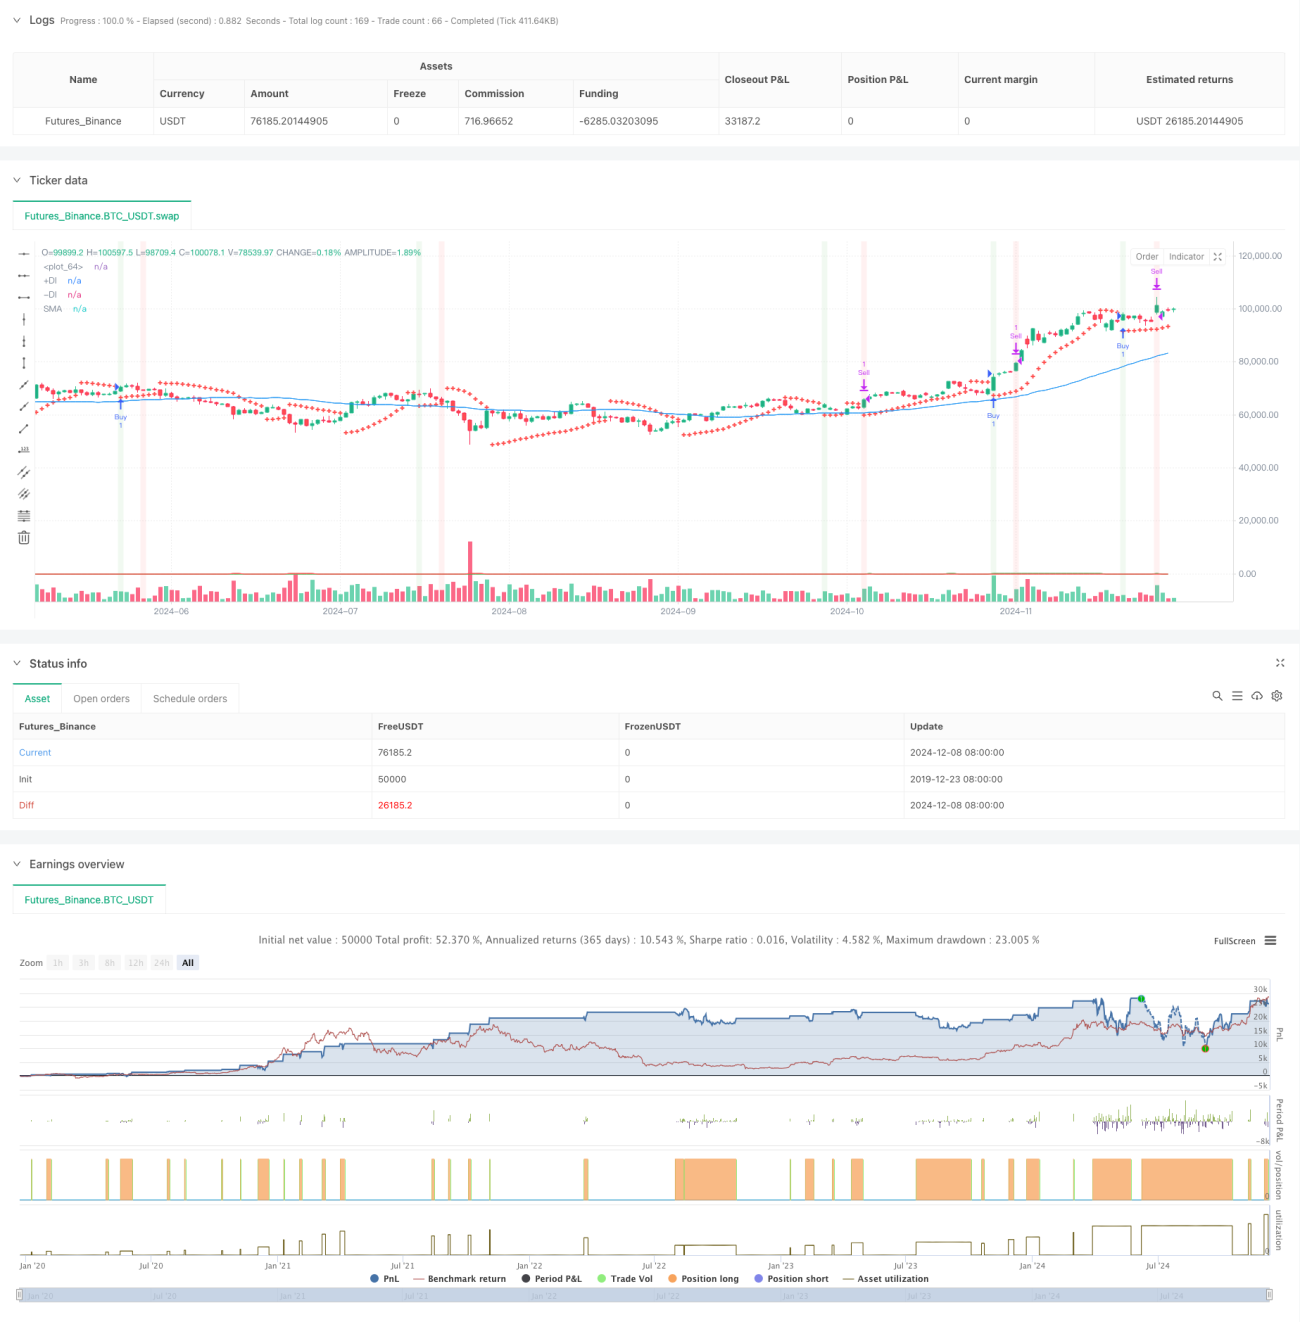
Strategi ini adalah sistem perdagangan pelacakan tren yang menggabungkan beberapa indikator teknis. Ini terutama menggunakan indikator parallax shift (SAR), moving average (SMA), dan directional momentum (DMI) untuk menentukan tren pasar dan waktu masuk, dan untuk mengoptimalkan keluar melalui persentase stop dan MACD backtrack.
Prinsip Strategi
Strategi ini menggunakan mekanisme penyaringan berlapis untuk mengkonfirmasi sinyal transaksi:
- Menangkap sinyal perdagangan awal melalui pengalihan indikator SAR
- Menggunakan 50 siklus SMA untuk menentukan arah tren secara keseluruhan
- Menggunakan indikator DMI untuk mengkonfirmasi kekuatan dan arah tren
- Syarat masuk harus dipenuhi pada saat bersamaan: harga di atas SAR, harga di atas SMA dan DMI menunjukkan tren multi arah
- Munculnya mekanisme ganda: mencapai target keuntungan 3% atau munculnya sinyal dead fork MACD
- Indeks ATR digunakan untuk referensi volatilitas pasar
Keunggulan Strategis
- Verifikasi silang dari beberapa indikator teknologi yang efektif untuk mengurangi sinyal palsu
- Menggabungkan trend tracking dan momentum indicator untuk meningkatkan tingkat keberhasilan trading
- Strategi Stop-Loss Persentase Tetap untuk Menjamin Keuntungan yang Tetap
- MACD berbalik dari mekanisme keluar untuk menghindari pembalikan tren
- Parameter strategi dapat disesuaikan dengan karakteristik pasar yang berbeda
- ATR digunakan untuk memantau volatilitas dan memberikan referensi kondisi pasar
Risiko Strategis
- Beberapa indikator dapat menyebabkan kelambatan sinyal
- Stopper Persentase Tetap Kemungkinan Keluar Lebih Awal Dari Tren Kuat
- Tidak ada mekanisme stop loss yang meningkatkan risiko
- Terlalu banyak sinyal palsu di pasar Forex
- Indikator DMI dapat memberikan sinyal yang menyesatkan di pasar yang bergoyang
Arah optimasi strategi
- Memperkenalkan mekanisme stop loss adaptif, seperti stop loss dinamis berbasis ATR
- Mengembangkan filter volatilitas untuk menyesuaikan skala kepemilikan selama periode volatilitas tinggi
- Mengoptimalkan parameter MACD untuk meningkatkan akurasi penilaian perubahan tren
- Tambahkan mekanisme konfirmasi volume untuk meningkatkan keandalan sinyal
- Mengembangkan mekanisme stop-loss dinamis untuk menyesuaikan target keuntungan berdasarkan fluktuasi pasar
Meringkaskan
Strategi ini dibangun melalui kolaborasi kolaborasi dari beberapa indikator teknis untuk membangun sistem perdagangan pelacakan tren yang relatif utuh. Keunggulan strategi ini adalah keandalan pengakuan sinyal dan fleksibilitas dalam pengendalian risiko. Meskipun ada risiko keterbelakangan tertentu, tetapi dengan optimasi parameter dan bergabung dengan mekanisme manajemen dinamis, kinerja keseluruhan strategi masih memiliki nilai aplikasi yang baik. Dengan optimasi dan perbaikan terus menerus, strategi ini dapat menjadi alat perdagangan yang solid.
- 1