Ringkasan
Strategi ini adalah sistem perdagangan multi-indikator yang kompleks, yang menggabungkan beberapa indikator teknis seperti RSI, MACD, moving average (SMA) dan lain-lain untuk mengidentifikasi peluang perdagangan dengan menganalisis tren harga dan dinamika. Strategi ini menggunakan garis rata-rata 200 hari untuk menilai tren jangka panjang, garis rata-rata 50 hari sebagai referensi tren jangka menengah, dan menggunakan sinyal silang RSI dan MACD acak untuk mengkonfirmasi waktu perdagangan.
Prinsip Strategi
Logika inti dari strategi ini dibangun atas tiga pilar utama:
- Penilaian tren: Menggunakan garis rata-rata 200 hari untuk menilai arah tren utama, harga di atas garis rata-rata adalah tren naik, di bawahnya adalah tren turun.
- Konfirmasi momentum: Menggunakan% K garis dan% D garis silang dari indikator RSI acak ((SRSI) untuk mengkonfirmasi pergerakan harga, ketika% K garis melintasi% D garis menunjukkan peningkatan momentum naik.
- Konfirmasi tren: Menggunakan indikator MACD sebagai alat konfirmasi tren, garis MACD mengkonfirmasi tren naik di atas garis sinyal.
Kondisi pembelian harus dipenuhi pada saat yang bersamaan:
- Harga di atas rata-rata 200 hari
- Random RSI dengan % K line dengan % D line
- Garis MACD berada di atas garis sinyal
Kondisi penjualan harus memenuhi:
- Harga berada di bawah rata-rata 200 hari
- Random RSI% K melalui% D
- Garis MACD berada di bawah garis sinyal
Keunggulan Strategis
- Multi-Verifikasi: Mengurangi risiko sinyal palsu dengan menggunakan kombinasi dari beberapa indikator teknis.
- Pelacakan tren: Menggabungkan garis rata-rata jangka panjang dan garis rata-rata jangka menengah untuk menangkap tren utama secara efektif.
- Identifikasi dinamika: Menggunakan RSI acak dapat menemukan titik-titik perubahan tren potensial lebih awal.
- Pengendalian risiko: Menggunakan garis rata-rata 50 hari sebagai referensi stop loss, memberikan mekanisme keluar yang jelas.
- Operasi sistematis: Strategi logis yang jelas, mudah untuk implementasi program dan verifikasi feedback.
Risiko Strategis
- Risiko keterlambatan: Moving Average pada dasarnya merupakan indikator keterlambatan, yang dapat menyebabkan keterlambatan waktu masuk dan keluar.
- Risiko pasar bergoyang: Dalam pasar bergoyang horizontal, beberapa indikator dapat menghasilkan sinyal yang berantakan.
- Risiko False Breakout: Harga dapat kembali ke posisi awal setelah jangka pendek melewati garis rata-rata, yang menyebabkan sinyal palsu.
- Sensitivitas parameter: pengaturan parameter untuk beberapa indikator perlu dioptimalkan untuk lingkungan pasar yang berbeda.
- Konflik sinyal: Indikator yang berbeda dapat menghasilkan sinyal yang saling bertentangan, meningkatkan kesulitan pengambilan keputusan.
Arah optimasi strategi
Optimalisasi parameter indikator:
- Anda dapat menelusuri kembali data historis untuk mencari periode rata-rata bergerak yang optimal.
- Optimalkan parameter RSI acak untuk menyesuaikan dengan fluktuasi pasar yang berbeda
Filter sinyal:
- Tambahkan mekanisme konfirmasi volume
- Memperkenalkan indikator volatilitas, menyesuaikan strategi perdagangan selama periode volatilitas tinggi
Pengelolaan risiko yang lebih baik:
- Menerapkan mekanisme stop loss yang dinamis
- Ukuran posisi yang disesuaikan dengan dinamika fluktuasi pasar
Adaptasi pasar:
- Menambahkan mekanisme identifikasi lingkungan pasar
- Menggunakan pengaturan parameter yang berbeda dalam kondisi pasar yang berbeda
Meringkaskan
Ini adalah strategi pelacakan tren yang sistematis, dengan penggunaan kombinasi dari beberapa indikator teknis, yang menjamin keandalan perdagangan, tetapi juga memberikan mekanisme kontrol risiko yang jelas. Keuntungan utama dari strategi ini adalah mekanisme verifikasi bertingkat, tetapi juga perlu berhati-hati untuk mengendalikan risiko keterlambatan yang mungkin ditimbulkan oleh beberapa indikator.
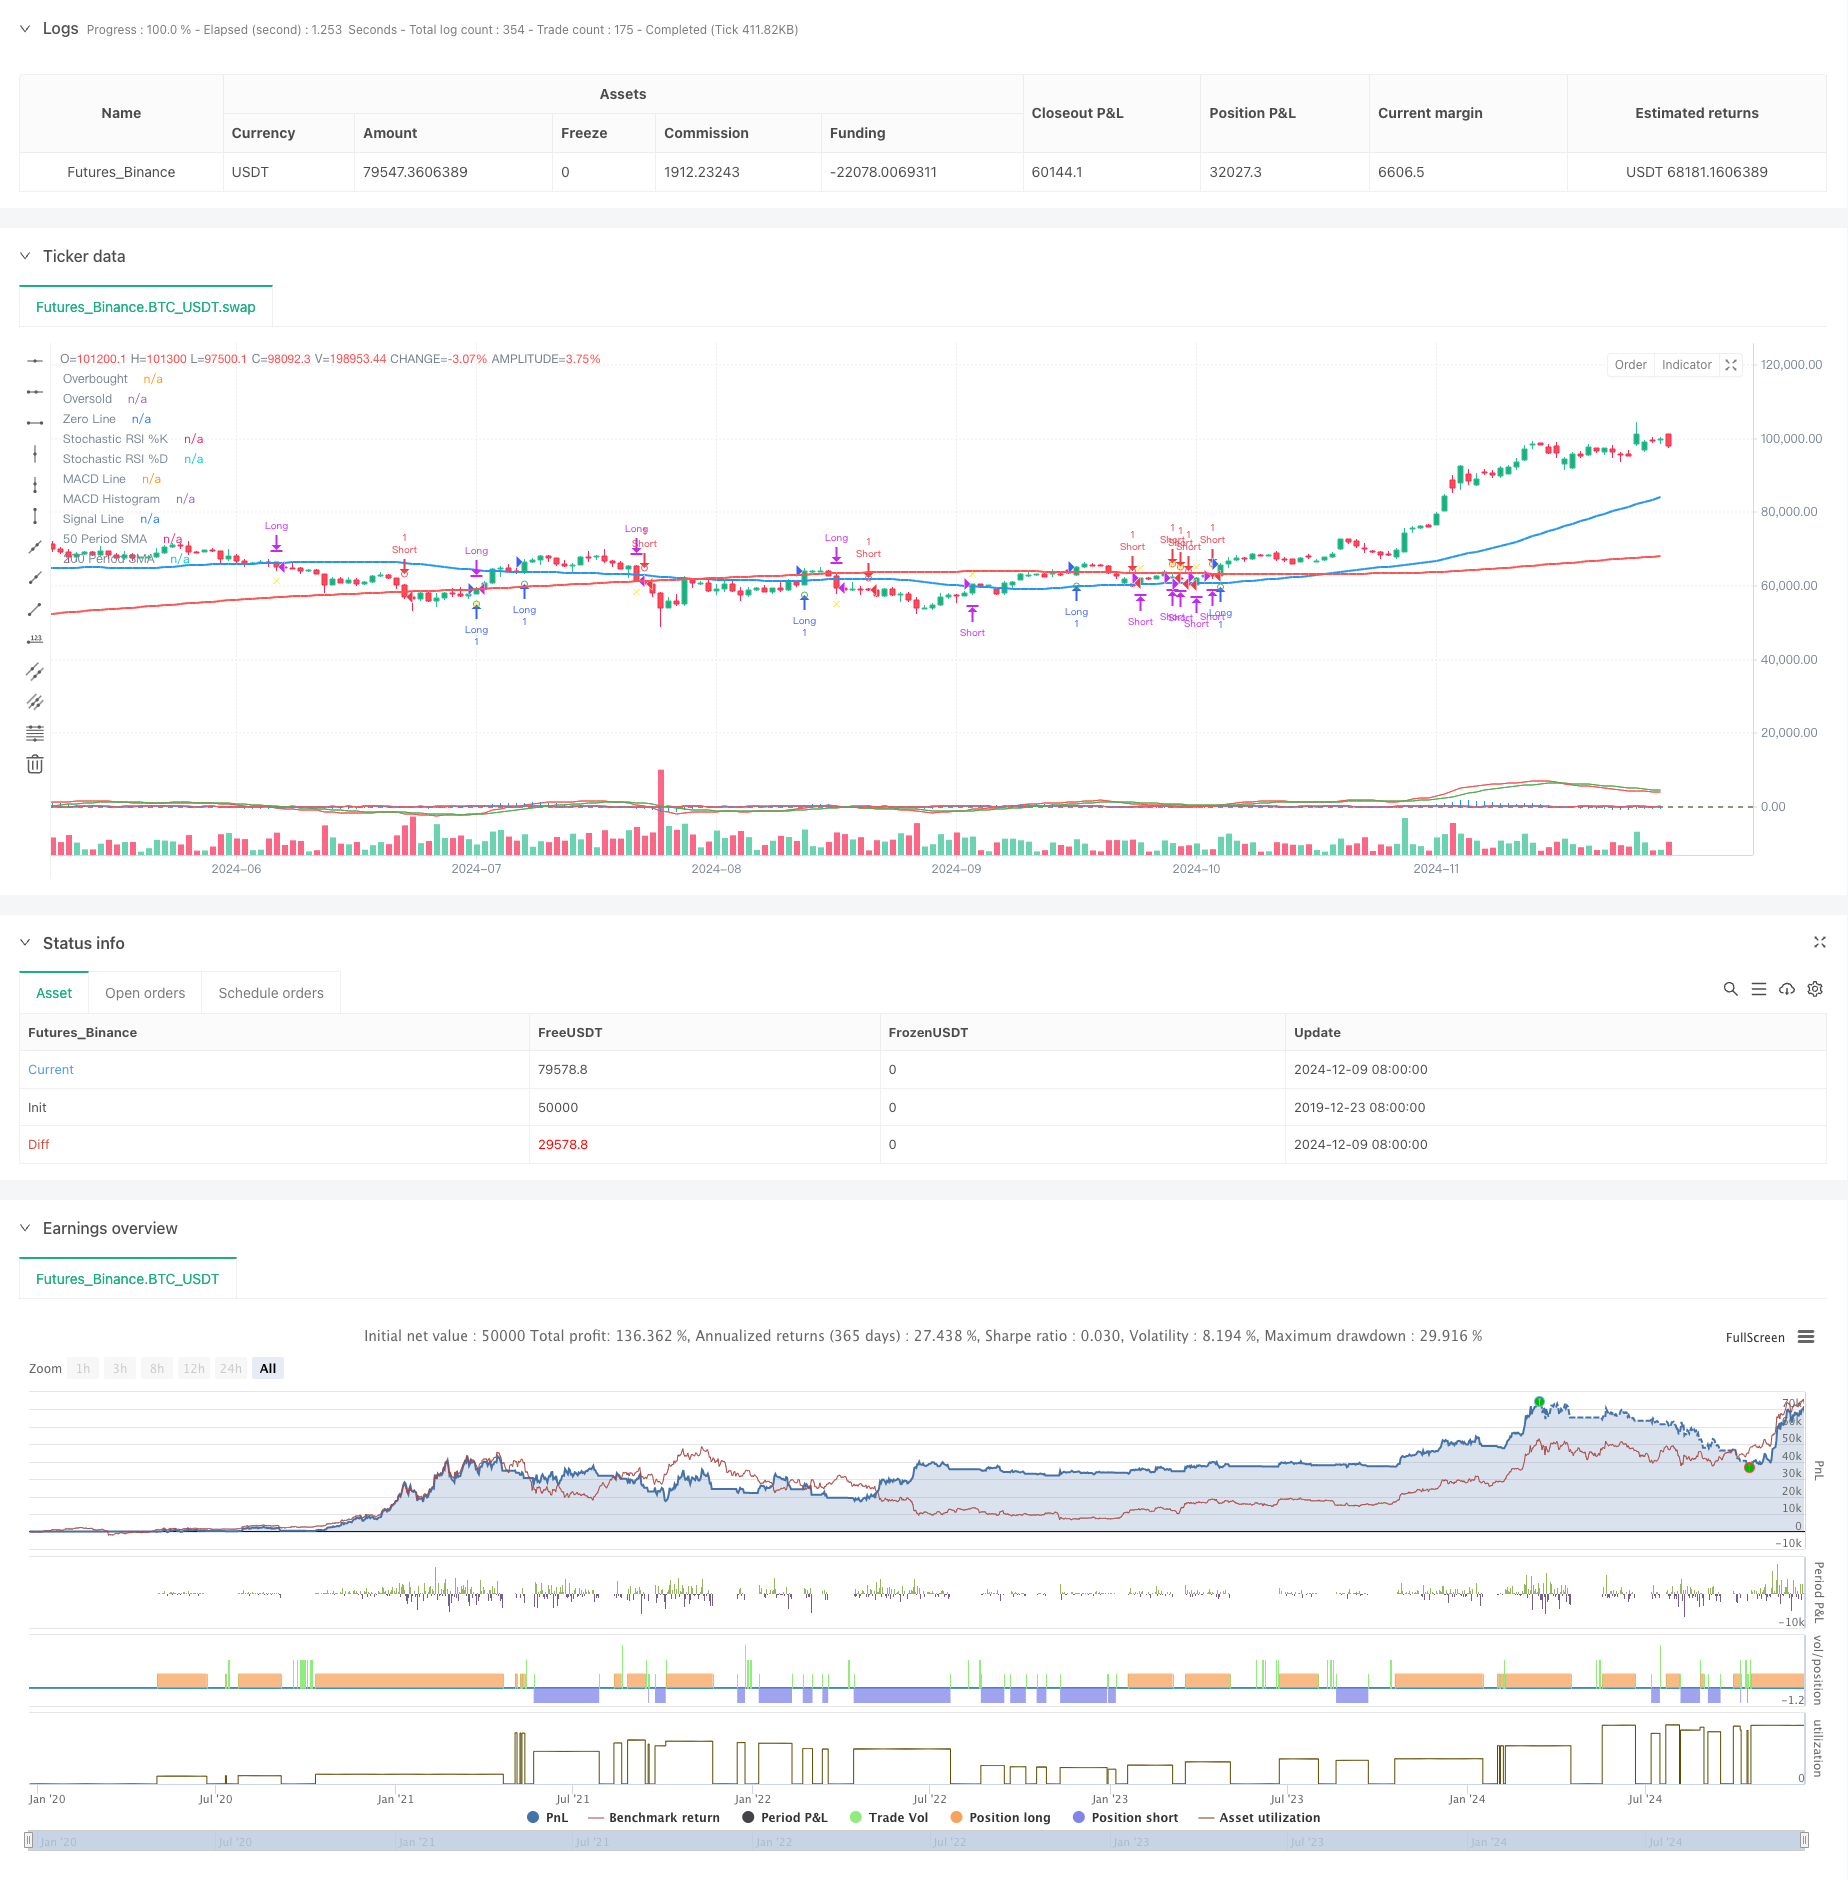
/*backtest
start: 2019-12-23 08:00:00
end: 2024-12-10 08:00:00
period: 1d
basePeriod: 1d
exchanges: [{"eid":"Futures_Binance","currency":"BTC_USDT"}]
*/

//@version=5
strategy("RSI and MACD by Karthik", overlay=true)

// Define periods for SMAs
sma50Period = 50
sma200Period = 200

// Calculate SMAs
sma50 = ta.sma(close, sma50Period)
sma200 = ta.sma(close, sma200Period)

// Plot SMAs on the main chart
plot(sma50, color=color.blue, title="50 Period SMA", linewidth=2)
plot(sma200, color=color.red, title="200 Period SMA", linewidth=2)

// Define and calculate parameters for Stochastic RSI
stochRSIPeriod = 14
rsi = ta.rsi(close, stochRSIPeriod)
stochRSIK = ta.stoch(rsi, rsi, stochRSIPeriod, 3)
stochRSID = ta.sma(stochRSIK, 3)

// Define and calculate parameters for MACD
macdShort = 12
macdLong = 26
macdSignal = 9
[macdLine, signalLine, macdHist] = ta.macd(close, macdShort, macdLong, macdSignal)

// Plot Stochastic RSI in a separate pane
hline(80, "Overbought", color=color.red, linewidth=1)
hline(20, "Oversold", color=color.green, linewidth=1)
plot(stochRSIK, color=color.blue, title="Stochastic RSI %K")
plot(stochRSID, color=color.red, title="Stochastic RSI %D")

// Plot MACD in a separate pane
hline(0, "Zero Line", color=color.gray, linewidth=1)
plot(macdHist, color=color.blue, title="MACD Histogram", style=plot.style_histogram)
plot(macdLine, color=color.red, title="MACD Line")
plot(signalLine, color=color.green, title="Signal Line")

// Conditions for buy and sell signals
isAbove200SMA = close > sma200
isStochRSIKAbove = stochRSIK > stochRSID
macdLineAbove = macdLine > signalLine
buySignal = isAbove200SMA and isStochRSIKAbove and macdLineAbove

isBelow200SMA = close < sma200
isStochRSIKBelow = stochRSIK < stochRSID
macdLineBelow = macdLine < signalLine
sellSignal = isBelow200SMA and isStochRSIKBelow and macdLineBelow

// Track the last signal with explicit type declaration
var string lastSignal = na

// Create series for plotting conditions
var bool plotBuySignal = na
var bool plotSellSignal = na
var bool plotExitBuySignal = na
var bool plotExitSellSignal = na

// Update plotting conditions based on signal and last signal
if buySignal and (lastSignal != "buy")
    plotBuySignal := true
    lastSignal := "buy"
else
    plotBuySignal := na

if sellSignal and (lastSignal != "sell")
    plotSellSignal := true
    lastSignal := "sell"
else
    plotSellSignal := na

// Update exit conditions based on SMA50
if lastSignal == "buy" and close < sma50
    plotExitBuySignal := true
    lastSignal := na // Clear lastSignal after exit
else
    plotExitBuySignal := na

if lastSignal == "sell" and close > sma50
    plotExitSellSignal := true
    lastSignal := na // Clear lastSignal after exit
else
    plotExitSellSignal := na

// Plot buy and sell signals on the main chart
plotshape(series=plotBuySignal, location=location.belowbar, color=color.green, style=shape.circle, size=size.small, title="Buy Signal")
plotshape(series=plotSellSignal, location=location.abovebar, color=color.red, style=shape.circle, size=size.small, title="Sell Signal")

// Plot exit signals for buy and sell
plotshape(series=plotExitBuySignal, location=location.belowbar, color=color.yellow, style=shape.xcross, size=size.small, title="Exit Buy Signal")
plotshape(series=plotExitSellSignal, location=location.abovebar, color=color.yellow, style=shape.xcross, size=size.small, title="Exit Sell Signal")


// Strategy to Backtest

long = buySignal
short = sellSignal

// Exit Conditions
exitBuy = close < sma50
exitSell = close > sma50


if (buySignal)
    strategy.entry("Long", strategy.long, 1.0)
if (sellSignal)
    strategy.entry("Short", strategy.short, 1.0)

strategy.close("Long", when=exitBuy)
strategy.close("Short", when=exitSell)