Strategi mengikuti tren multi-indikator dikombinasikan dengan saluran dinamis dan sistem perdagangan rata-rata bergerak

1
Follow
1785
Followers
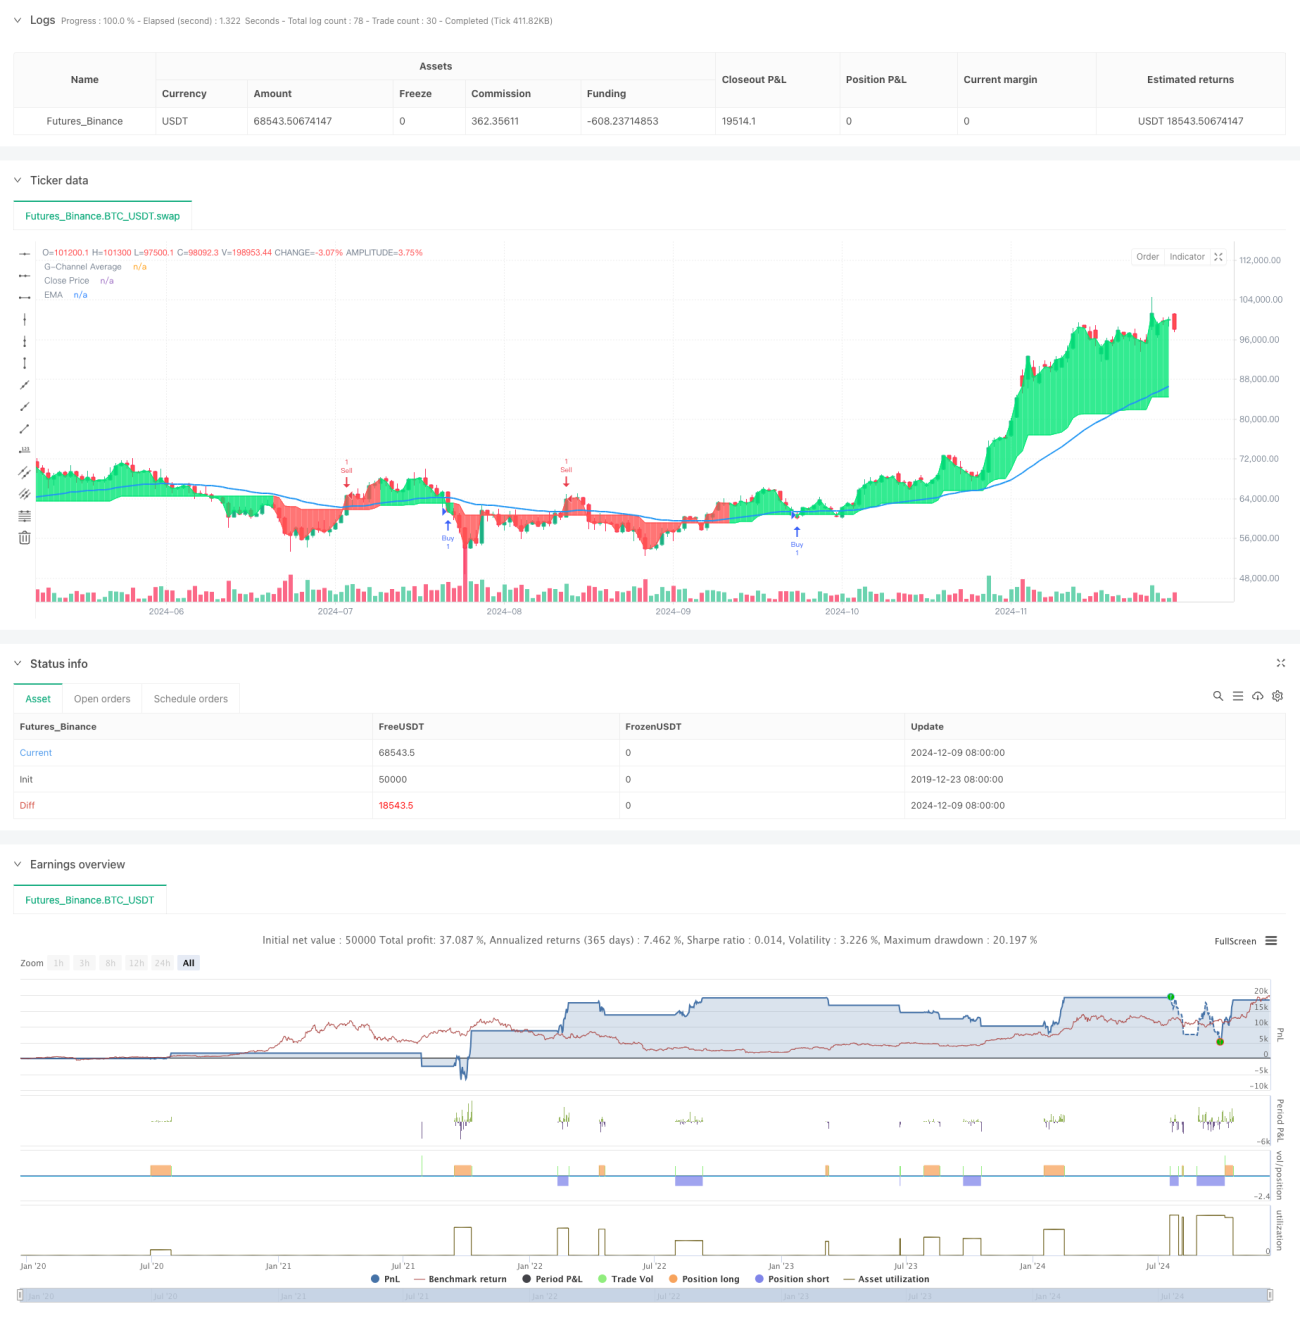
Ringkasan
Strategi ini adalah sistem perdagangan multi-indikator yang menggabungkan G-Channel, EMA, dan amplitudo fluktuasi nyata ATR. Ini mengidentifikasi sinyal perdagangan melalui dukungan / resistensi dinamis dan konfirmasi tren, dan mengelola risiko dengan menggunakan stop loss dan stop loss berbasis ATR.
Prinsip Strategi
Logika inti dari strategi ini didasarkan pada beberapa komponen utama:
- G channel menghitung level dukungan dan resistensi dinamis, terus menyesuaikan naik dan turun melalui rumus matematika
- EMA digunakan untuk mengkonfirmasi arah tren secara keseluruhan, posisi harga terhadap EMA menentukan arah perdagangan
- Sinyal masuk berdasarkan terobosan saluran G dan konfirmasi posisi EMA
- Atur stop loss dan stop loss dengan ATR, stop loss 2x ATR, stop loss 4x ATR
- Menghindari sinyal berulang berturut-turut melalui pelacakan status
Keunggulan Strategis
- Mekanisme konfirmasi sinyal bertingkat meningkatkan keandalan transaksi
- Perbatasan saluran yang disesuaikan secara dinamis untuk menyesuaikan dengan kondisi pasar yang berbeda
- Manajemen risiko berbasis volatilitas lebih adaptif
- Mencegah sinyal berulang mengurangi risiko overtrading
- Tanda jual beli yang jelas dan visual untuk analisis dan pengamatan
Risiko Strategis
- Di pasar Forex, mungkin ada terlalu banyak sinyal palsu.
- EMA sebagai indikator keterlambatan dapat menyebabkan penundaan waktu masuk
- Stop loss ATR dengan kelipatan tetap mungkin tidak cukup fleksibel pada periode fluktuasi tinggi
- Data historis yang lebih panjang diperlukan untuk menghitung berbagai indikator
- Optimasi parameter dapat menyebabkan overfitting
Arah optimasi strategi
- Masukkan sinyal konfirmasi lalu lintas untuk meningkatkan keandalan penembusan
- Beradaptasi secara dinamis dengan ATR untuk beradaptasi dengan kondisi pasar yang berbeda
- Menambahkan filter lingkungan pasar untuk menghindari perdagangan di bawah kondisi yang tidak menguntungkan
- Optimalkan Logika Filter Sinyal untuk Mengurangi Sinyal Palsu
- Pertimbangkan untuk bergabung dengan sistem manajemen posisi yang dinamis
Meringkaskan
Strategi ini membangun sistem perdagangan yang lengkap dengan menggabungkan beberapa indikator teknis yang sudah mapan. Keunggulan sistem ini adalah mekanisme pengesahan sinyal bertingkat dan manajemen risiko berbasis volatilitas, tetapi masih perlu dioptimalkan sesuai dengan karakteristik pasar tertentu dalam aplikasi nyata.
Source
Pine
Strategy parameters
Related strategies
Comment
All comments (0)
No data
- 1