
Ringkasan
Strategi ini adalah sistem pelacakan tren berbasis analisis teknis, yang menggabungkan sistem garis rata, indikator dinamika RSI, dan indikator volatilitas ATR untuk mengkonfirmasi peluang perdagangan melalui verifikasi sinyal ganda. Strategi ini menggunakan garis rata lintas periode untuk menilai tren pasar, sekaligus mengkonfirmasi kekuatan harga dalam kombinasi dengan dinamika RSI, dan akhirnya menggunakan posisi stop loss dan keuntungan dinamis ATR untuk membentuk sistem perdagangan yang lengkap.
Prinsip Strategi
Logika inti dari strategi ini terdiri dari tiga bagian penting:
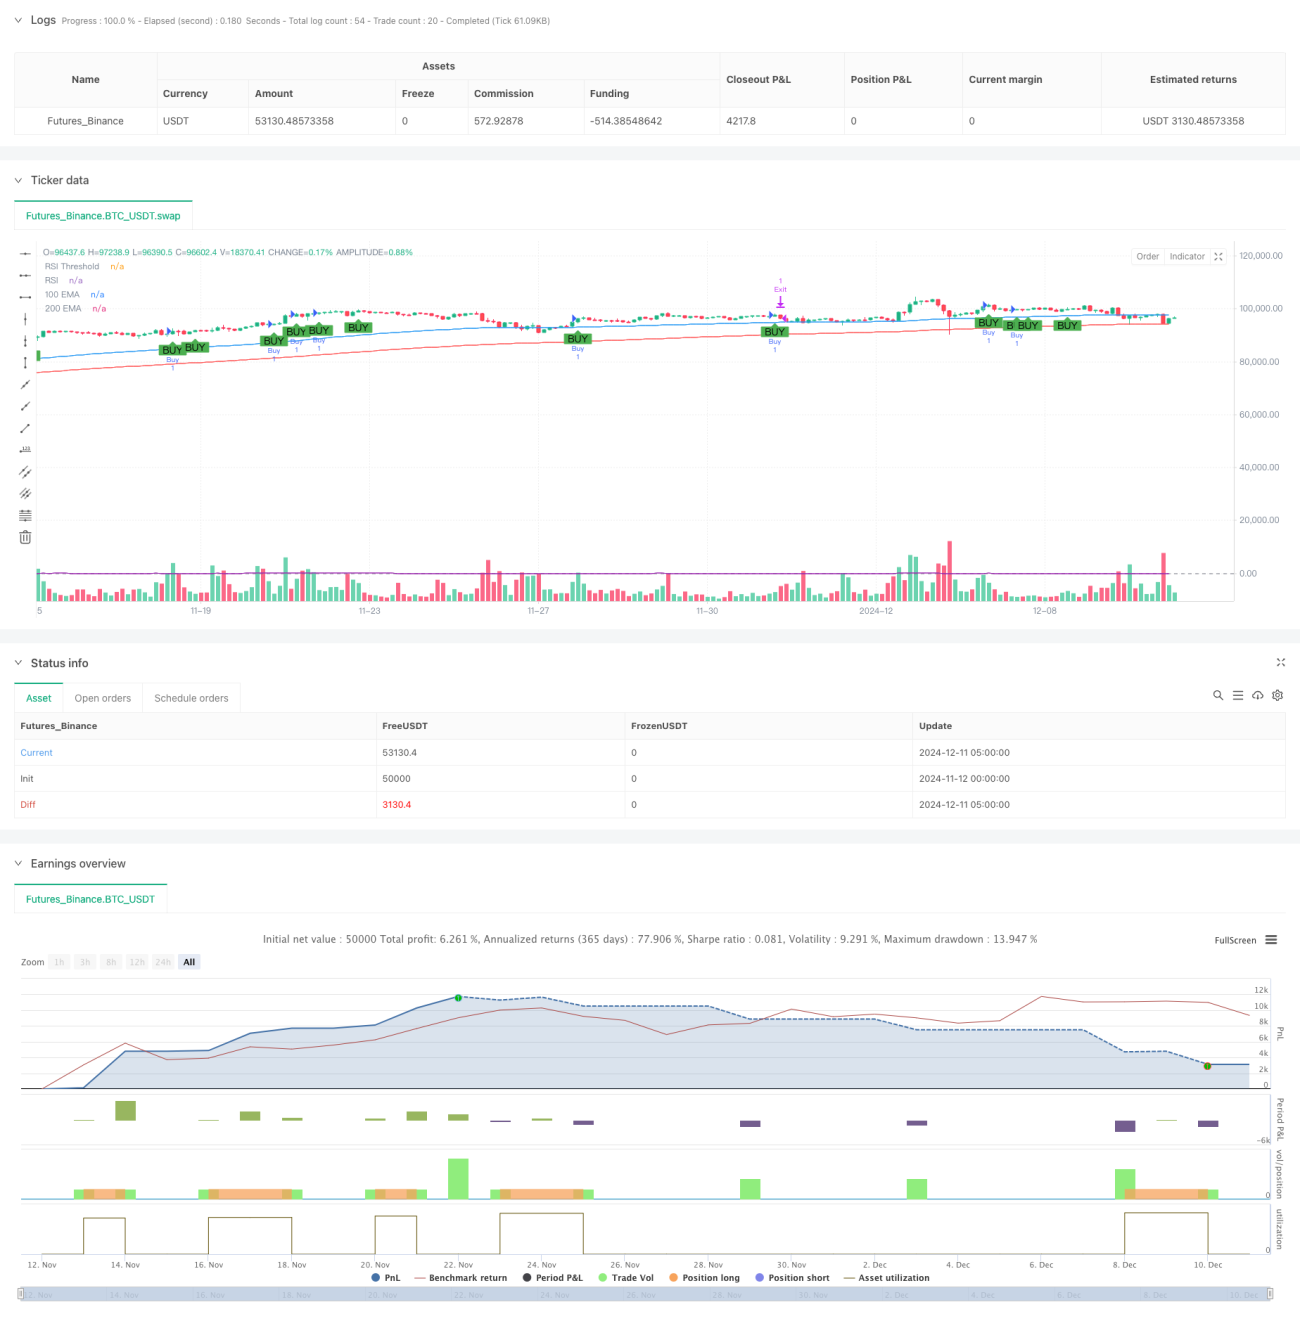
- Pengertian tren: Menggunakan 100 siklus dengan 200 siklus indeks bergerak rata-rata (EMA) silang untuk mengkonfirmasi arah tren pasar. Ketika EMA jangka pendek berada di atas EMA jangka panjang, menunjukkan bahwa pasar berada dalam tren naik.
- Sinyal masuk: Berdasarkan konfirmasi tren, strategi mencari bentuk penetrasi bullish sebagai titik masuk spesifik dan memfilter sinyal menggunakan indikator RSI. Ketika nilai RSI lebih besar dari 50, menunjukkan bahwa pasar memiliki cukup momentum ke atas.
- Manajemen posisi: Menggunakan ATR 14 siklus untuk mengukur volatilitas pasar, dan secara dinamis mengatur level stop loss dan profit sesuai dengan hal tersebut. Stop loss diatur menjadi 1.1 kali ATR, target profit menjadi 2.0 kali ATR, pengaturan ini menjamin rasio untung-rugi lebih besar dari 1.
Keunggulan Strategis
- Multi-Signal Validation: Mengurangi dampak dari sinyal palsu dengan menggabungkan trend, bentuk harga, dan dinamika indikator.
- Pengelolaan risiko dinamis: Pengaturan stop loss dan profit berdasarkan ATR, dapat disesuaikan dengan volatilitas pasar, menghindari keterbatasan yang ditimbulkan oleh titik tetap.
- Fitur pelacakan tren: menilai tren melalui sistem rata-rata garis, yang efektif menghindari perdagangan yang tidak perlu di pasar horizontal atau turun.
- Kerangka perdagangan yang lengkap: mencakup sistem strategi yang lengkap untuk masuk, keluar, dan manajemen posisi.
Risiko Strategis
- EMA sebagai indikator yang tertinggal dapat menyebabkan terlambatnya waktu masuk, dan dapat melewatkan titik masuk terbaik di pasar yang berfluktuasi cepat.
- Perhitungan risiko pasar: Dalam pasar horizontal, seringnya persilangan rata-rata dapat menyebabkan perdagangan berlebihan.
- Risiko penembusan palsu: Penembusan palsu dapat terjadi dalam bentuk penyalahgunaan pupuk, yang perlu dikelola melalui kontrol risiko yang ketat.
- Stop loss setup risk: ATR yang terlalu kecil dapat menyebabkan stop loss yang terlalu sering, sedangkan ATR yang terlalu besar dapat menimbulkan risiko yang terlalu besar.
Arah optimasi strategi
- Masukkan indikator lalu lintas: dapat meningkatkan keandalan sinyal dengan menambahkan konfirmasi lalu lintas.
- Optimalkan siklus rata-rata: Anda dapat menyesuaikan siklus rata-rata sesuai dengan karakteristik pasar yang berbeda, sehingga lebih sesuai dengan irama pasar.
- Perbaikan mekanisme stop loss: Pertimbangan untuk menambahkan stop loss mobile, yang dapat melindungi jika tren berlanjut.
- Meningkatkan filter lingkungan pasar: memperkenalkan penilaian rentang volatilitas, mengurangi frekuensi perdagangan dalam lingkungan pasar yang bergejolak.
- Optimalkan parameter RSI: dapat ditelusuri kembali berdasarkan data historis untuk mencari nilai terendah RSI dan periode perhitungan yang optimal.
Meringkaskan
Strategi ini membangun sistem pelacakan tren yang logis dan lengkap dengan mengintegrasikan beberapa indikator teknis. Keunggulan strategi ini terletak pada verifikasi sinyal ganda dan manajemen risiko dinamis, tetapi juga perlu memperhatikan risiko seperti penundaan tren dan false breaks. Strategi ini masih memiliki peningkatan yang signifikan dengan menambahkan konfirmasi lalu lintas, pengoptimalan pengaturan parameter, dll. Secara keseluruhan, strategi ini cocok untuk beroperasi di pasar dengan tren yang jelas, dan memiliki nilai aplikasi yang baik untuk melacak tren jangka menengah dan panjang.
- 1