Penelitian tentang versi optimal dari strategi entri fleksibel crossover lima hari berdasarkan RSI dan MACD

Ringkasan
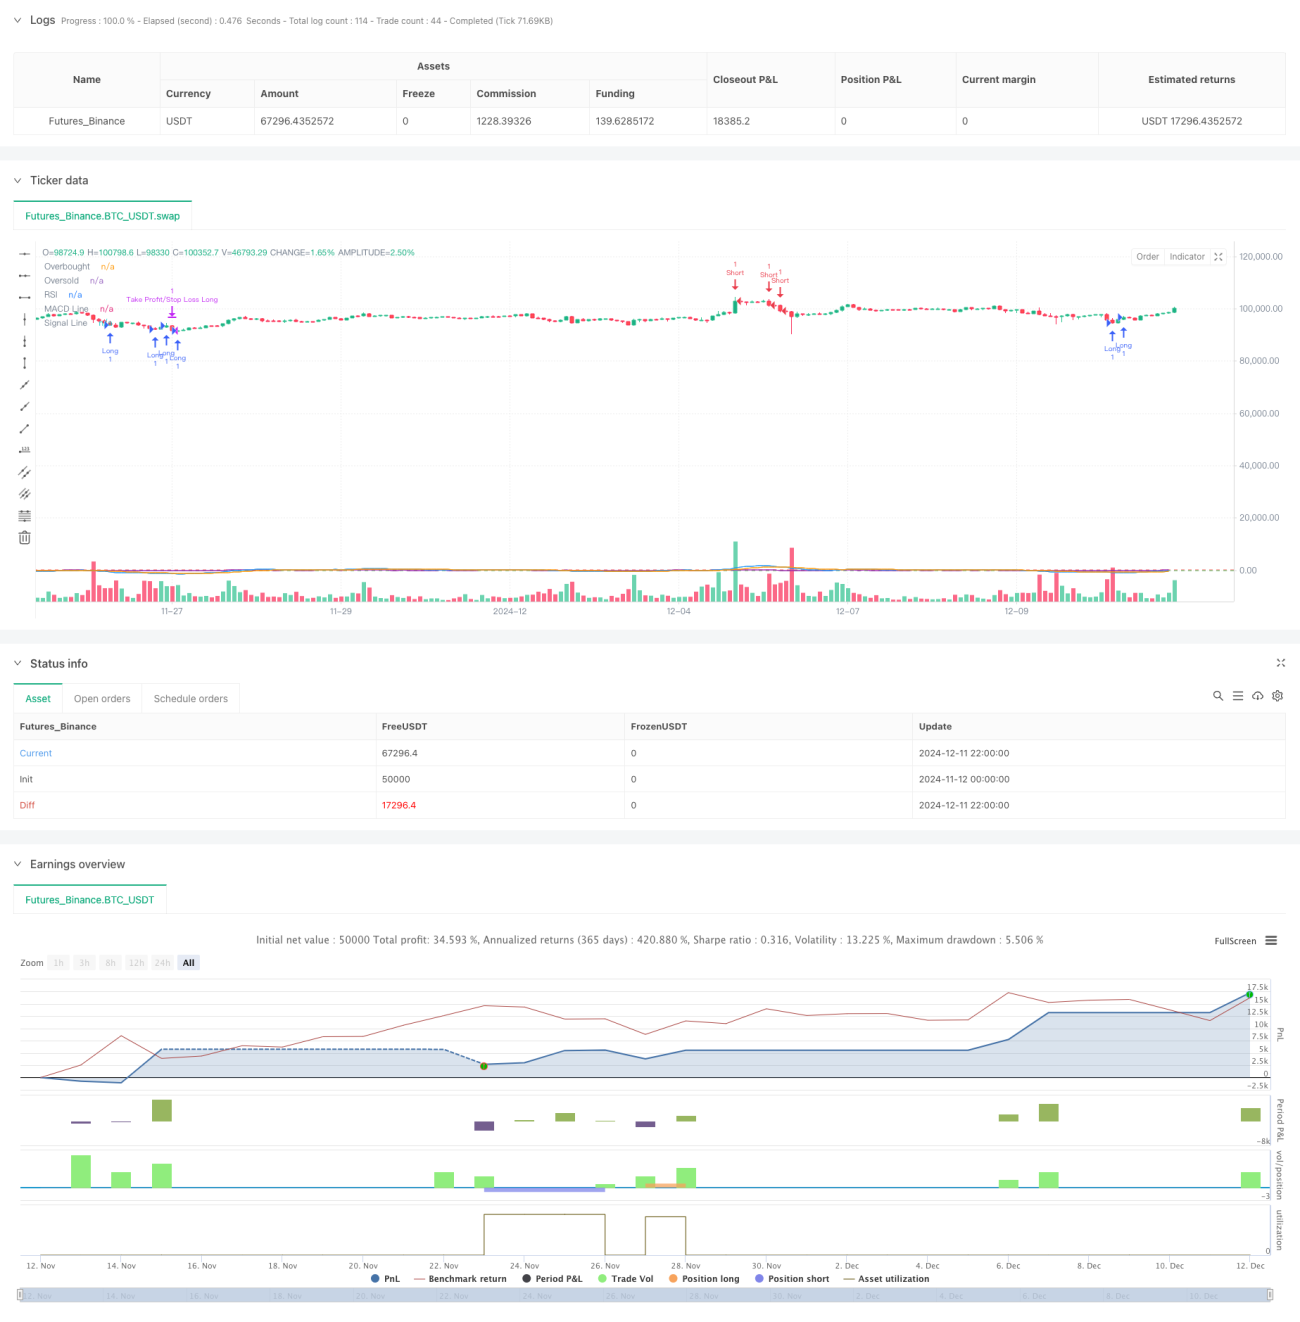
Strategi ini adalah strategi perdagangan kuantitatif yang menggabungkan indeks relatif kuat (RSI) dan indikator pergerakan rata-rata trend / spread (MACD). Inti dari strategi ini adalah dengan mengamati area overbought / oversold RSI, menggabungkan sinyal MACD untuk menentukan arah tren pasar dalam hampir 5 siklus perdagangan, dan mengatur stop loss untuk mengendalikan risiko.
Prinsip Strategi
Strategi ini didasarkan pada komponen inti berikut:
- Indikator RSI menggunakan 14 siklus sebagai pengaturan parameter untuk mengidentifikasi peluang terbalik potensial dengan menilai apakah aset berada dalam kondisi overbought (<70) atau oversold (<30).
- Indikator MACD menggunakan kombinasi parameter 12-26-9 klasik untuk mengkonfirmasi perubahan tren dengan mencari persilangan garis MACD dan garis sinyal dalam 5 siklus perdagangan.
- Logika input terdiri dari dua kondisi:
- Terjadi beberapa kondisi: RSI dalam 5 periode memiliki nilai minimum di bawah 30, sementara garis MACD muncul dalam hampir 5 periode dengan garis sinyal yang bersilang ke atas.
- Kondisi kosong: RSI memiliki nilai tertinggi di atas 70 selama 5 periode, sementara garis MACD muncul di dekat garis sinyal yang melintas ke bawah selama 5 periode.
- Pengendalian risiko menggunakan simetris 2% stop loss dan 2% stop loss setting.
Keunggulan Strategis
- Multi-indicator cross-verifikasi meningkatkan keandalan sinyal, dengan penggunaan RSI dan MACD dalam kombinasi, dapat secara efektif menyaring sinyal palsu yang mungkin dihasilkan oleh indikator tunggal.
- Fleksibel 5-hari periode observasi jendela dapat menangkap lebih banyak peluang perdagangan, dan menghindari kehilangan titik-titik penting di pasar.
- Setting stop-loss yang simetris membantu dalam pengelolaan dana dan dapat mengontrol risiko transaksi tunggal secara efektif.
- Logika strategi sederhana dan jelas, mudah dipahami dan diterapkan, dan cocok untuk dioptimalkan lebih lanjut berdasarkan strategi.
Risiko Strategis
- RSI dan MACD adalah indikator lag, yang dapat terjadi dalam pasar yang sangat bergejolak.
- Rasio stop loss yang tetap mungkin tidak cocok untuk semua kondisi pasar dan perlu disesuaikan dengan perubahan volatilitas.
- Periode observasi 5 hari mungkin terlalu pendek dalam kondisi pasar tertentu, yang menyebabkan perdagangan berlebihan.
- Tanpa mempertimbangkan faktor volume transaksi, sinyal mungkin tidak akurat dalam lingkungan likuiditas rendah.
Arah optimasi strategi
- Memperkenalkan mekanisme penyesuaian diri terhadap volatilitas, menyesuaikan stop loss rasio secara dinamis sesuai dengan fluktuasi pasar.
- Menambahkan indikator volume transaksi sebagai konfirmasi tambahan untuk meningkatkan keandalan sinyal.
- Mengembangkan mekanisme pilihan siklus dinamis yang secara otomatis menyesuaikan ukuran jendela observasi sesuai dengan kondisi pasar.
- Menambahkan filter tren untuk menghindari perdagangan berlawanan arah di pasar yang sedang tren.
- Pertimbangkan untuk menerapkan filter waktu untuk menghindari perdagangan pada saat-saat yang bergejolak seperti saat pasar terbuka dan ditutup.
Meringkaskan
Strategi ini membangun sistem perdagangan yang relatif lengkap dengan menggabungkan indikator RSI dan MACD, dengan persyaratan masuk yang fleksibel dan mekanisme pengendalian risiko. Meskipun ada beberapa tempat yang perlu dioptimalkan, kerangka dasar memiliki skalabilitas yang baik, dan dengan pengoptimalan dan perbaikan lebih lanjut, diharapkan menjadi strategi perdagangan yang lebih kuat.
- 1