
Ringkasan
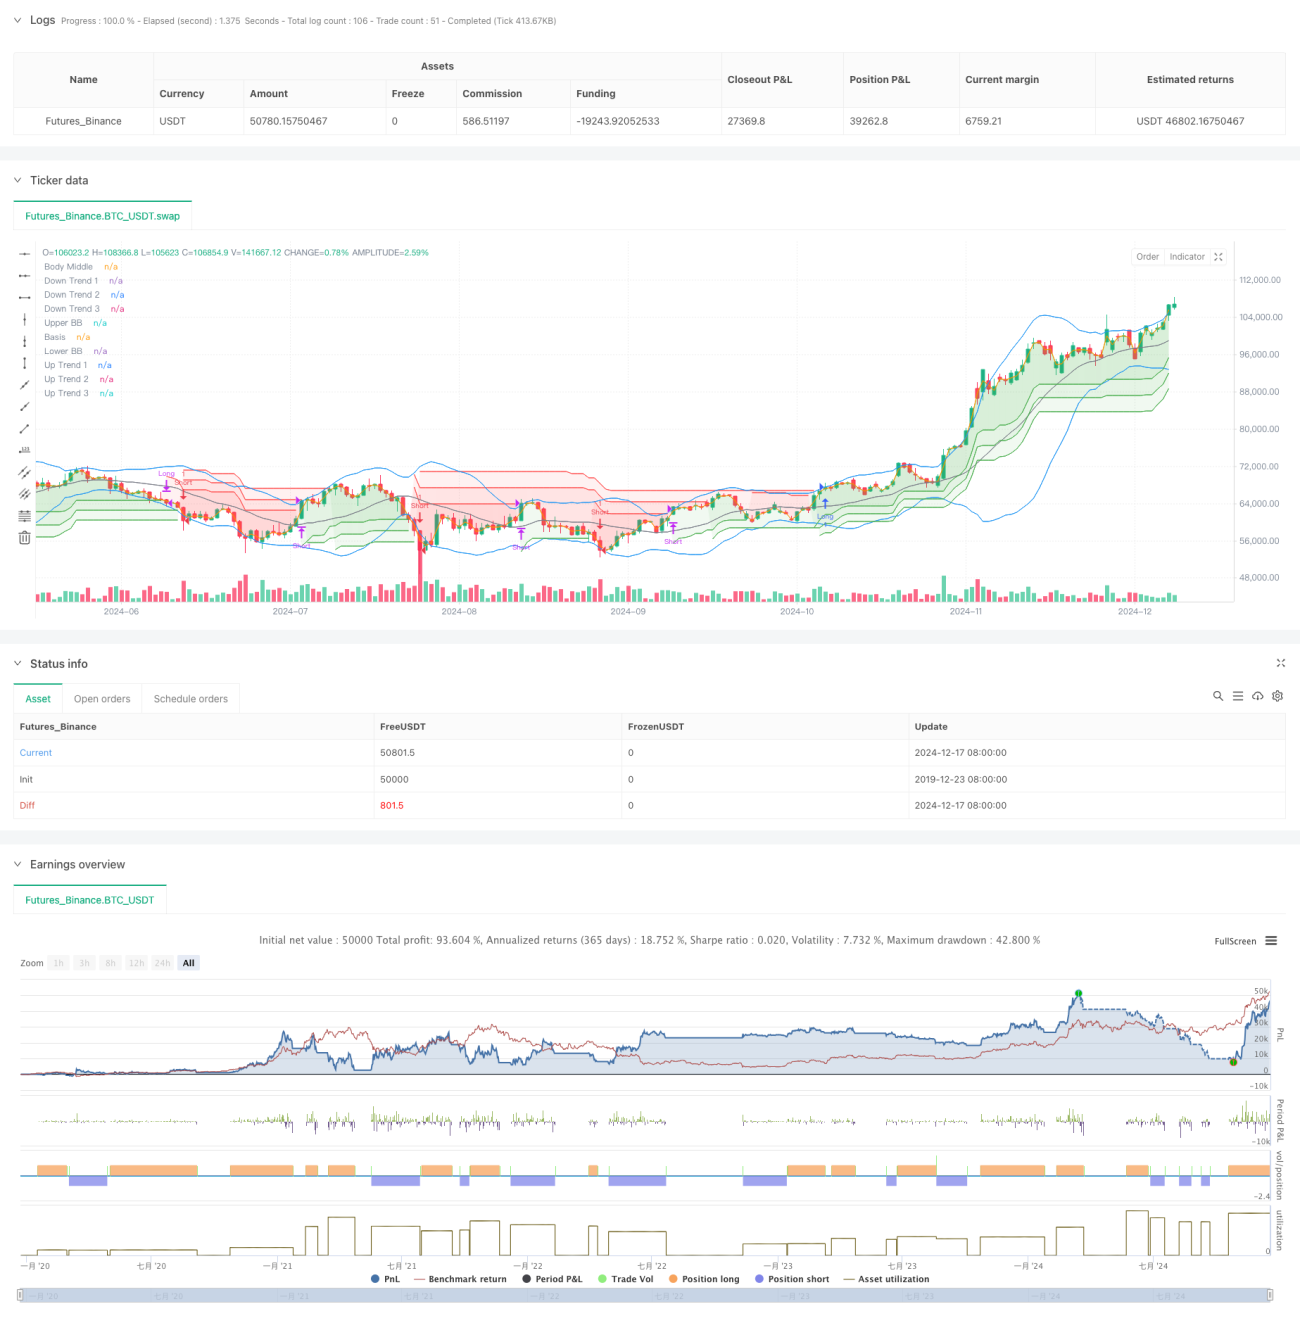
Strategi ini menggunakan kombinasi Bollinger Bands dan indikator Triple Supertrend untuk melakukan trading. Dengan penilaian rentang volatilitas dari Bollinger Bands dan konfirmasi tren dari Triple Supertrend, terbentuklah sistem pelacakan tren yang kokoh. Bollinger Bands digunakan untuk mengidentifikasi fluktuasi harga yang ekstrem, sementara Triple Supertrend memberikan konfirmasi arah tren yang berlapis melalui pengaturan parameter yang berbeda. Trading hanya dilakukan ketika semua sinyal selaras, sehingga mengurangi risiko sinyal palsu. Metode kombinasi ini mempertahankan keunggulan pelacakan tren sekaligus meningkatkan keandalan trading.
Prinsip Strategi
Logika inti strategi mencakup beberapa bagian kunci berikut:
- Menggunakan Bollinger Bands periode 20 dengan kelipatan deviasi standar 2,0 untuk menilai fluktuasi harga
- Menyiapkan tiga garis Supertrend dengan periode 10, masing-masing dengan parameter 3,0, 4,0, dan 5,0
- Kondisi masuk posisi beli: harga menembus pita atas Bollinger Bands dan ketiga garis Supertrend semuanya menunjukkan tren naik
- Kondisi masuk posisi jual: harga menembus pita bawah Bollinger Bands dan ketiga garis Supertrend semuanya menunjukkan tren turun
- Ketika salah satu garis Supertrend berubah arah, posisi saat ini ditutup
- Menggunakan garis harga tengah sebagai referensi pengisian untuk meningkatkan efek visual
Keunggulan Strategi
- Mekanisme konfirmasi berlapis: Kombinasi Bollinger Bands dan Triple Supertrend secara signifikan mengurangi sinyal palsu
- Kemampuan pelacakan tren yang kuat: Pengaturan parameter progresif pada indikator Supertrend mampu menangkap tren pada berbagai level secara efektif
- Manajemen risiko yang baik: Keluar posisi dengan cepat saat tren menunjukkan tanda-tanda pembalikan, mengendalikan penarikan (drawdown)
- Parameter yang mudah disesuaikan: Setiap parameter indikator dapat dioptimalkan sesuai dengan karakteristik pasar yang berbeda
- Tingkat otomatisasi tinggi: Logika strategi jelas, memudahkan implementasi secara sistematis
Risiko Strategi
- Risiko pasar bergerak sideways: Dalam pasar yang bergerak sideways, sinyal breakout palsu dapat sering terjadi
- Dampak slippage: Pada periode fluktuasi yang hebat, dapat menghadapi kerugian slippage yang besar
- Risiko keterlambatan: Mekanisme konfirmasi berlapis dapat menyebabkan waktu masuk posisi yang agak terlambat
- Sensitivitas parameter: Kombinasi parameter yang berbeda dapat menyebabkan perbedaan kinerja strategi yang signifikan
- Ketergantungan pada kondisi pasar: Strategi bekerja lebih baik di pasar dengan tren yang jelas
Arah Optimasi Strategi
- Memasukkan indikator volume: Mengonfirmasi validitas breakout harga melalui volume
- Mengoptimalkan mekanisme stop loss: Dapat menambahkan trailing stop atau stop loss dinamis berbasis ATR
- Menambahkan filter waktu: Melarang trading pada periode waktu tertentu untuk menghindari fluktuasi yang tidak efisien
- Menambahkan filter volatilitas: Menyesuaikan posisi atau menghentikan trading pada periode volatilitas berlebih
- Mengembangkan mekanisme parameter adaptif: Menyesuaikan parameter secara dinamis berdasarkan kondisi pasar
Kesimpulan
Ini adalah strategi pelacakan tren yang menggabungkan Bollinger Bands dan Triple Supertrend, meningkatkan keandalan trading melalui konfirmasi dari beberapa indikator teknis. Strategi ini memiliki kemampuan menangkap tren dan mengelola risiko yang kuat, namun juga perlu memperhatikan pengaruh kondisi pasar terhadap kinerjanya. Melalui optimasi dan penyempurnaan berkelanjutan, strategi ini diharapkan dapat mempertahankan kinerja yang stabil di berbagai kondisi pasar. Disarankan untuk melakukan backtesting dan optimasi parameter yang memadai sebelum trading riil, serta melakukan penyesuaian yang sesuai berdasarkan situasi pasar aktual.
//@version=5
strategy("Demo GPT - Bollinger + Triple Supertrend Combo", overlay=true, commission_type=strategy.commission.percent, commission_value=0.1, slippage=3)

// -------------------------------
// User Input for Date Range
// -------------------------------
startDate = input(title="Start Date", defval=timestamp("2018-01-01 00:00:00"))
endDate   = input(title="End Date",   defval=timestamp("2069-12-31 23:59:59"))

// -------------------------------
// Bollinger Band Inputs
// -------------------------------- 1