
Ringkasan
Strategi ini adalah strategi perdagangan opsi yang melacak tren berdasarkan kombinasi beberapa indikator teknis. Strategi ini terutama menggunakan EMA crossover sebagai sinyal inti, yang digabungkan dengan SMA, VWAP untuk mengkonfirmasi arah tren, dan menggunakan MACD dan RSI sebagai indikator tambahan untuk memfilter sinyal. Strategi ini menggunakan manajemen risiko stop loss tetap untuk meningkatkan tingkat keberhasilan perdagangan melalui persyaratan masuk dan manajemen posisi yang ketat.
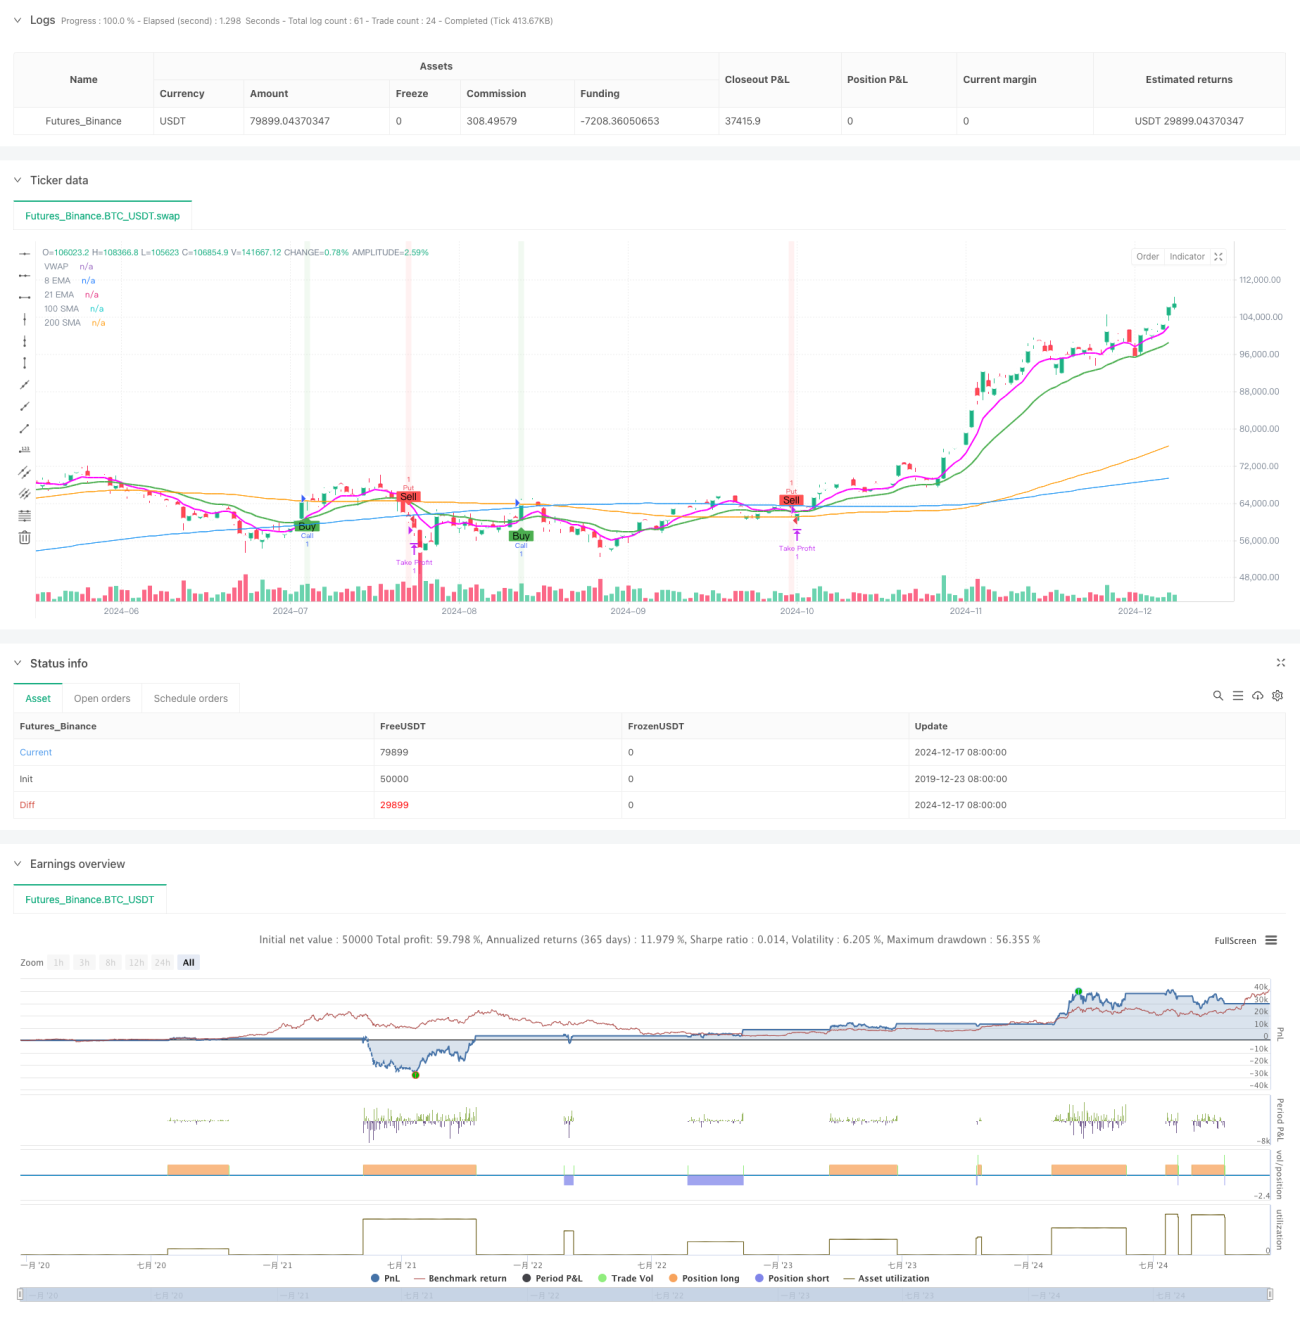
Prinsip Strategi
Strategi ini menggunakan persilangan 8 siklus dan 21 siklus EMA sebagai sinyal perdagangan utama, dan memicu beberapa sinyal ketika EMA jangka pendek melewati EMA jangka panjang dan memenuhi kondisi berikut: harga berada di atas 100 dan 200 siklus SMA, MACD di atas garis sinyal, RSI lebih besar dari 50. Syarat pemicu sinyal shorting sebaliknya. Strategi ini memperkenalkan VWAP sebagai referensi berat harga untuk membantu menentukan posisi relatif harga saat ini.
Keunggulan Strategis
- Koordinasi multi-indikator, meningkatkan keandalan sinyal melalui verifikasi silang berbagai siklus dan jenis indikator
- Menggunakan kombinasi dari trend tracking dan momentum indicator untuk menangkap tren dan memperhatikan momentum jangka pendek
- Fixed Stop Loss Points Membantu Menjaga Keuntungan dan Mencegah Keserakahan
- Manajemen kepemilikan yang ketat, menghindari pembukaan posisi berulang, mengurangi risiko eksposur
- Efek visual yang jelas, termasuk pergerakan EMA, SMA, VWAP dan tanda sinyal
Risiko Strategis
- Sinyal palsu sering terjadi di pasar yang bergejolak
- Stop loss tetap dapat menyebabkan kehilangan peluang keuntungan yang lebih besar
- Tidak ada setelan stop loss yang dapat menanggung kerugian lebih besar dalam situasi ekstrem
- Penggunaan beberapa indikator dapat menyebabkan keterlambatan sinyal
- Pada kontrak opsi yang kurang likuid, risiko slippage mungkin terjadi
Arah optimasi strategi
- Memperkenalkan mekanisme stop loss yang dapat disesuaikan dengan dinamika volatilitas pasar
- Menambahkan modul manajemen volume transaksi, menyesuaikan posisi secara dinamis sesuai dengan ukuran akun dan kondisi pasar
- Tambahkan filter volatilitas pasar untuk menyesuaikan parameter strategi dalam lingkungan volatilitas tinggi
- Optimalkan parameter indikator, pertimbangkan untuk menggunakan siklus adaptif dan bukan siklus tetap
- Menambahkan filter waktu untuk menghindari perdagangan pada saat-saat bergejolak seperti saat pasar terbuka dan ditutup
Meringkaskan
Ini adalah strategi perdagangan opsi multi-indikator yang terstruktur, logis, dan jelas. Strategi ini meningkatkan keandalan sinyal perdagangan dengan sinkronisasi beberapa indikator teknis, dan menggunakan titik tolak tetap untuk mengelola risiko. Meskipun ada beberapa risiko yang melekat pada strategi, strategi ini dapat ditingkatkan lebih lanjut dengan stabilitas dan profitabilitas melalui arah pengoptimalan yang diusulkan.
/*backtest
start: 2019-12-23 08:00:00
end: 2024-12-18 08:00:00
period: 1d
basePeriod: 1d
exchanges: [{"eid":"Futures_Binance","currency":"BTC_USDT"}]
*/

//@version=5
strategy("OptionsMillionaire Strategy with Take Profit Only", overlay=true, default_qty_type=strategy.fixed, default_qty_value=1)

// Define custom magenta color- 1