
Gambaran Umum
Strategi ini adalah sistem trading komprehensif yang menggabungkan beberapa indikator teknis, terutama dengan memantau momentum pasar dan perubahan tren secara dinamis untuk menangkap peluang trading. Strategi ini mengintegrasikan sistem rata-rata bergerak (EMA), Relative Strength Index (RSI), Moving Average Convergence Divergence (MACD), Bollinger Bands (BB), dan indikator lainnya, serta memperkenalkan mekanisme stop-loss dinamis berdasarkan Average True Range (ATR), sehingga mencapai analisis multidimensi pasar dan pengendalian risiko.
Prinsip Strategi
Strategi ini mengadopsi mekanisme konfirmasi sinyal bertingkat, yang terutama mencakup aspek-aspek berikut:
- Penentuan Tren: Menggunakan persilangan EMA periode 7 dan 14 untuk menentukan arah tren pasar.
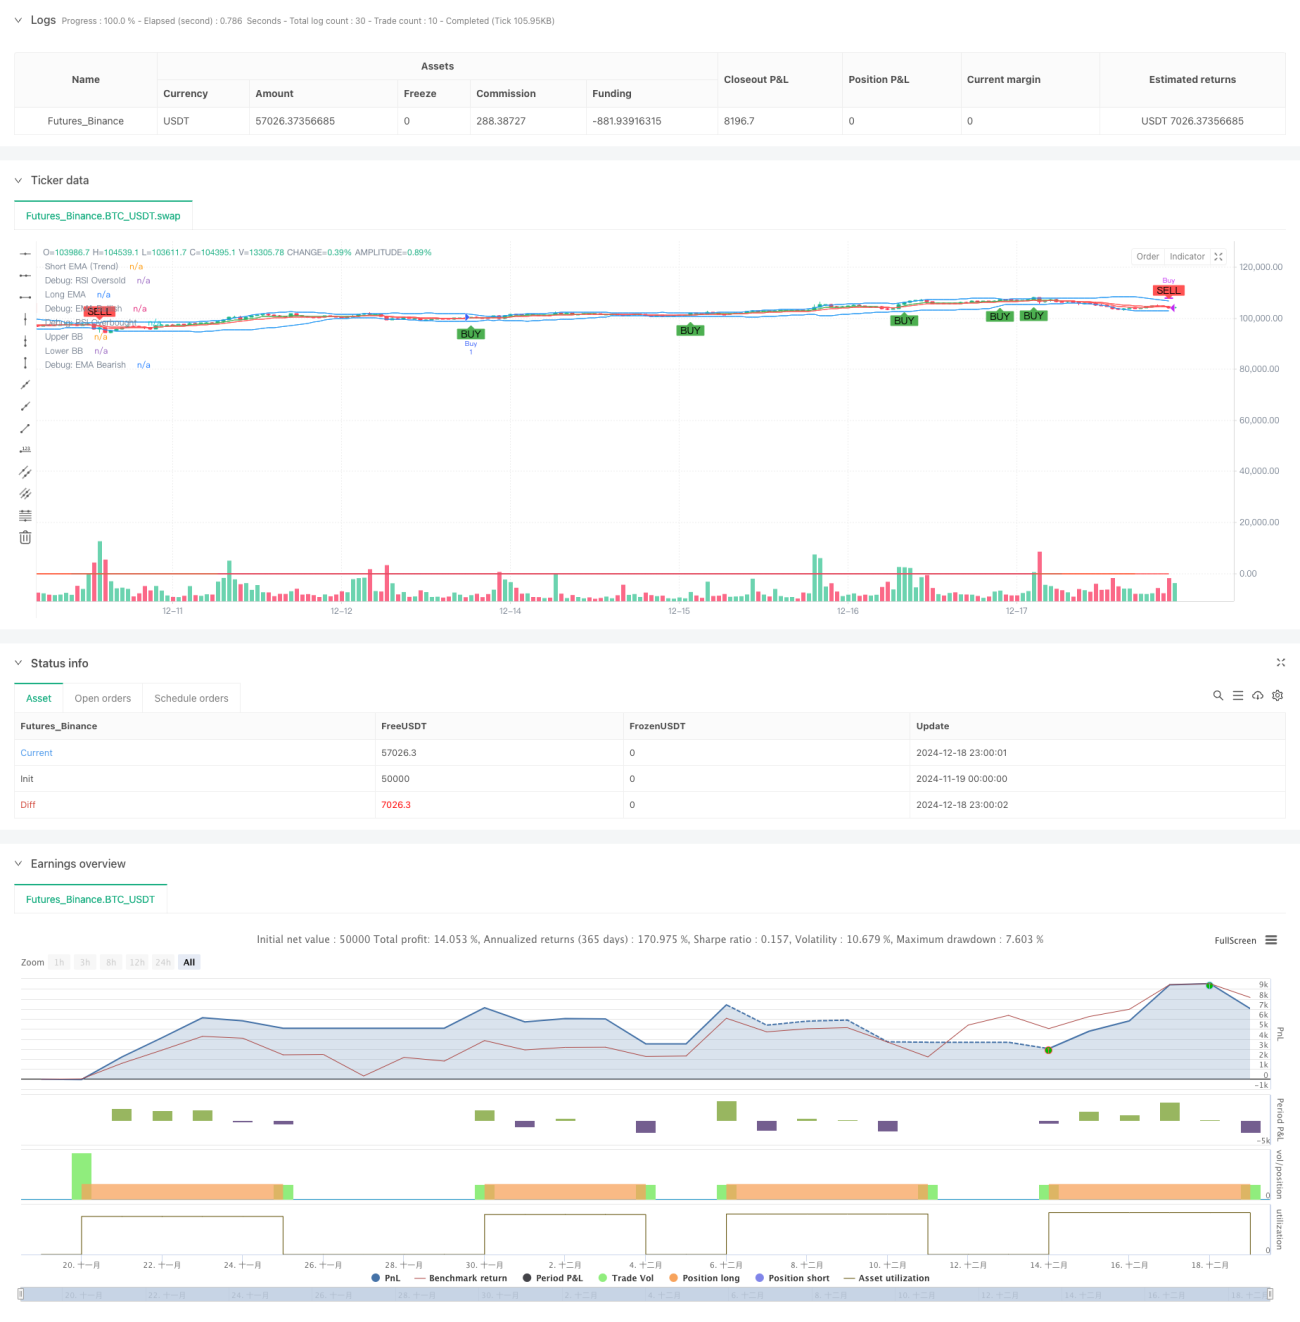
- Analisis Momentum: Memantau kondisi overbought/oversold pasar melalui indikator RSI, dengan ambang batas dinamis 30/70.
- Konfirmasi Kekuatan Tren: Menggunakan indikator ADX untuk menilai kekuatan tren, dengan ADX > 25 mengonfirmasi adanya tren yang kuat.
- Penentuan Rentang Volatilitas: Menggunakan Bollinger Bands untuk menentukan rentang fluktuasi harga, serta menghasilkan sinyal trading berdasarkan sentuhan harga pada pita.
- Verifikasi Volume: Menggunakan filter volume rata-rata dinamis untuk memastikan trading terjadi pada tingkat aktivitas pasar yang memadai.
- Pengendalian Risiko: Strategi stop-loss dinamis yang dirancang berdasarkan indikator ATR, dengan jarak stop-loss sebesar 1,5 kali ATR.
Keunggulan Strategi
- Verifikasi sinyal multidimensi, secara efektif mengurangi sinyal palsu.
- Mekanisme stop-loss dinamis meningkatkan kemampuan adaptasi risiko strategi.
- Menggabungkan volume dan analisis kekuatan tren, meningkatkan keandalan trading.
- Parameter indikator dapat disesuaikan, memiliki adaptabilitas yang baik.
- Mekanisme entry dan exit yang lengkap, logika trading jelas.
- Menggunakan indikator teknis standar, mudah dipahami dan dipelihara.
Risiko Strategi
- Banyaknya indikator dapat menyebabkan keterlambatan sinyal.
- Optimasi parameter mungkin memiliki risiko overfitting.
- Di pasar sideways dapat menghasilkan trading yang sering.
- Sistem sinyal yang kompleks dapat meningkatkan beban komputasi.
- Memerlukan ukuran sampel yang lebih besar untuk memvalidasi efektivitas strategi.
Arah Optimasi Strategi
- Memperkenalkan mekanisme adaptif volatilitas pasar, menyesuaikan parameter indikator secara dinamis.
- Menambahkan filter waktu untuk menghindari trading pada periode yang tidak menguntungkan.
- Mengoptimalkan strategi take profit, dapat mempertimbangkan penggunaan trailing stop.
- Memasukkan pertimbangan biaya trading, mengoptimalkan kondisi pembukaan dan penutupan posisi.
- Memperkenalkan mekanisme manajemen posisi untuk menyesuaikan ukuran posisi secara dinamis.
Kesimpulan
Strategi ini membangun sistem trading yang relatif lengkap melalui kerja sama multi-indikator. Keunggulan intinya terletak pada mekanisme konfirmasi sinyal multidimensi dan sistem pengendalian risiko dinamis, tetapi juga perlu memperhatikan optimasi parameter dan masalah adaptasi pasar. Melalui optimasi dan penyesuaian yang berkelanjutan, strategi ini diharapkan dapat mempertahankan kinerja yang stabil di berbagai kondisi pasar.
- 1