Terobosan rentang SMA ganda dan strategi perdagangan kuantitatif penguncian keuntungan dinamis

SMA
Tanggal Pembuatan: 2024-12-20 16:28:54 Akhirnya memodifikasi: 2024-12-20 16:28:54
menyalin: 0 Jumlah klik: 441
1
fokus pada
1617
Pengikut

Terobosan rentang SMA ganda dan strategi perdagangan kuantitatif penguncian keuntungan dinamis

Ringkasan

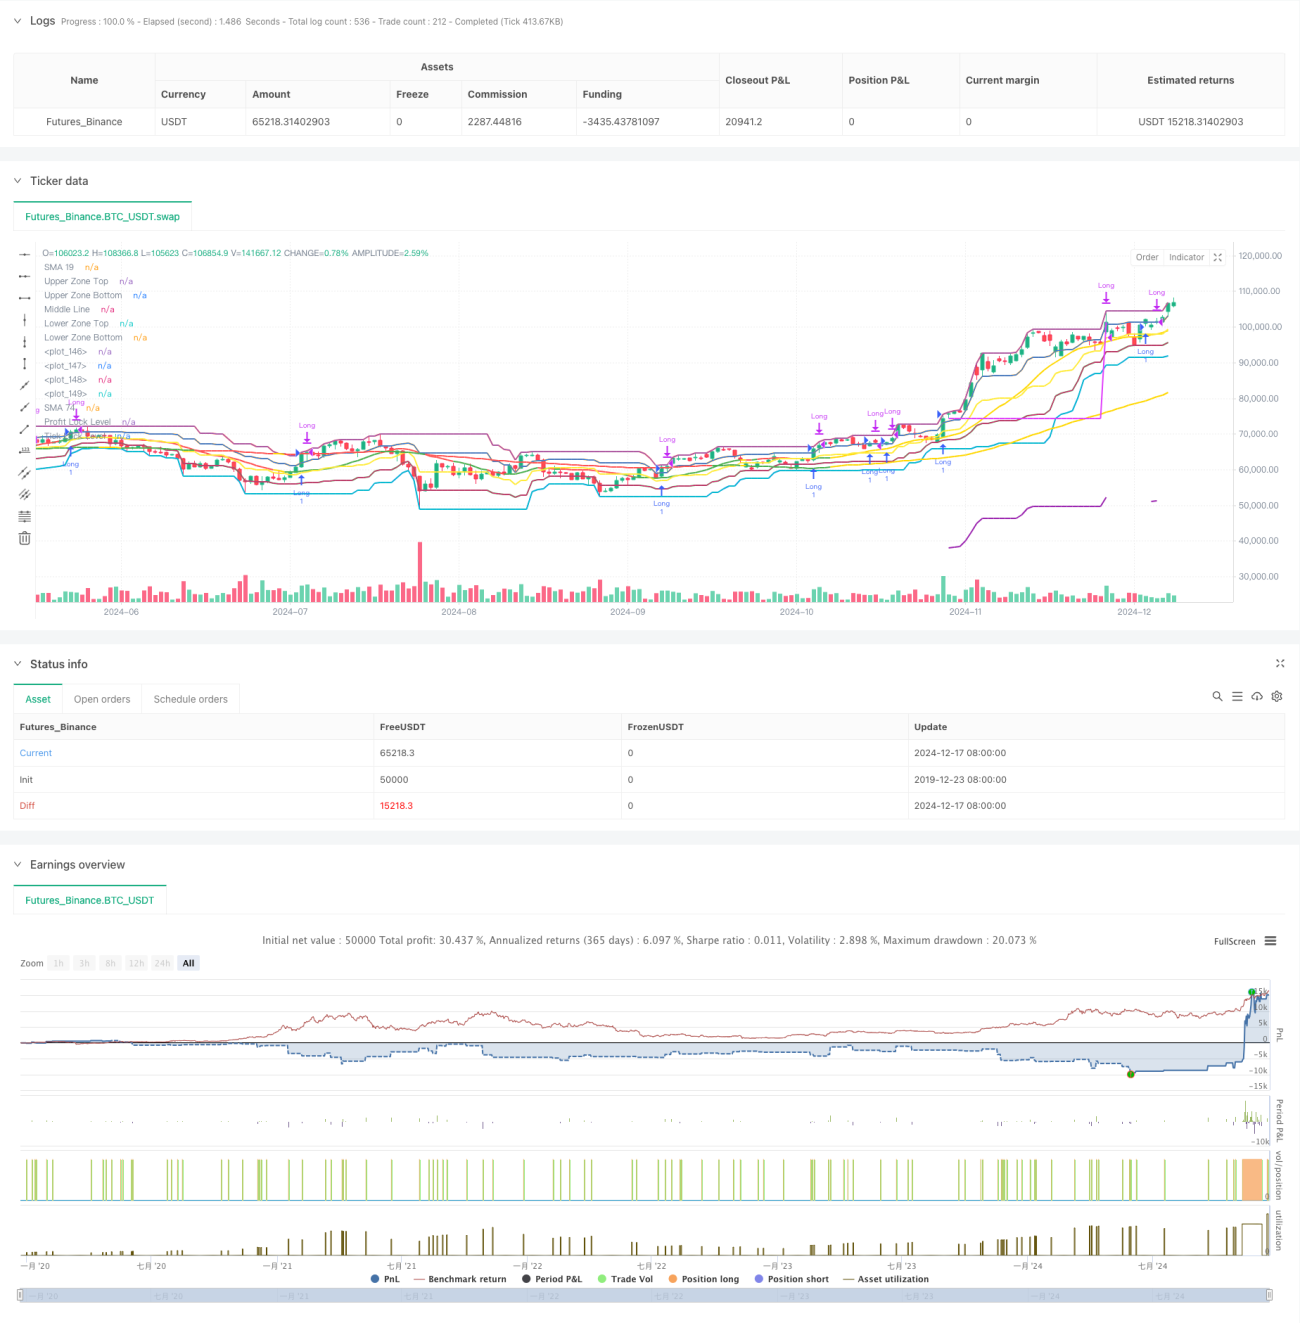
Ini adalah strategi perdagangan pelacakan tren dinamis berdasarkan indikator SMA, yang menggabungkan rentang harga, indikator acak, dan mekanisme perlindungan keuntungan ganda. Strategi ini dilakukan dengan memantau pergerakan harga di berbagai rentang, menggabungkan sinyal silang dari rata-rata bergerak jangka pendek dan jangka panjang, dan menggunakan indikator acak untuk menentukan status pasar dan kekuatan tren, untuk menangkap tren yang efisien.

Prinsip Strategi

Logika inti dari strategi ini mencakup bagian-bagian utama berikut:

  1. Membangun kerangka tren dengan 19 siklus dan 74 siklus SMA
  2. Indikator acak 60 periode untuk menilai kondisi pasar, dengan warna SMA dibedakan menjadi empat kondisi kuning, hijau, merah, dan kuning
  3. 5 tingkatan penting dalam kisaran harga yang digunakan untuk menilai kekuatan dan kelemahan harga
  4. Syarat masuk harus dipenuhi pada saat yang bersamaan:
    • SMA berwarna hijau atau kuning
    • Harga Menembus Zona Oranye
    • Penutupan harga di atas SMA jangka pendek
  5. Ada dua jenis penghentian:
    • Proteksi yang dibatalkan berdasarkan persentase harga tertinggi
    • Penguncian laba berdasarkan poin tetap

Keunggulan Strategis

  1. Multiple Authentication Mechanism Menurunkan Signal Palsu
  2. Divisi yang dinamis beradaptasi dengan kondisi pasar yang berbeda
  3. Mekanisme penutupan ganda memberikan kontrol risiko yang lebih baik
  4. Klasifikasi keadaan pasar yang jelas membantu untuk memahami irama pasar
  5. Pemantauan status transaksi secara real-time untuk memudahkan debug strategi
  6. Kombinasi Indikator Teknis dan Analisis Perilaku Harga

Risiko Strategis

  1. Pasar yang bergejolak dapat menyebabkan overtrading
  2. Penghitungan titik-titik tetap mungkin terlewatkan.
  3. Optimasi parameter dapat menyebabkan overfitting
  4. Beberapa keuntungan yang mungkin hilang jika pasar berbalik dengan cepat
  5. Kondisi konfirmasi ganda mungkin melewatkan beberapa peluang transaksi Solusi:
  • Menambahkan filter tingkat fluktuasi
  • Dinamiskan parameter stop
  • Meningkatkan mekanisme identifikasi lingkungan pasar
  • Optimalkan penilaian timing

Arah optimasi strategi

  1. Masukkan parameter penyesuaian dinamis indikator volatilitas
  2. Mengadaptasi kondisi stop sesuai dengan kondisi pasar
  3. Tambahkan mekanisme konfirmasi volume transaksi
  4. Tambahkan filter intensitas tren
  5. Optimalkan Metode Pembagian Daerah, Mempertimbangkan Karakteristik Pasar
  6. Meningkatkan mekanisme manajemen risiko, seperti:
    • Stop loss per hari
    • Kontrol penarikan maksimum
    • Pembatasan jangka waktu

Meringkaskan

Strategi ini membangun sistem perdagangan yang lengkap dengan menggunakan beberapa indikator teknis dan analisis perilaku harga secara komprehensif. Keunggulan strategi ini adalah mekanisme konfirmasi ganda dan sistem hambatan yang fleksibel, tetapi juga perlu memperhatikan dampak lingkungan pasar pada kinerja strategi. Dengan terus mengoptimalkan dan menyempurnakan manajemen risiko, strategi ini diharapkan untuk mempertahankan kinerja yang stabil di berbagai lingkungan pasar.

Kode Sumber Strategi
/*backtest
start: 2019-12-23 08:00:00
end: 2024-12-18 08:00:00
period: 1d
basePeriod: 1d
exchanges: [{"eid":"Futures_Binance","currency":"BTC_USDT"}]
*/

//@version=5
strategy(title="SMA Color Strategy", 
     overlay=true, 
     initial_capital=10000,
     max_bars_back=5000,
     max_labels_count=500,
     max_boxes_count=500,
     default_qty_type=strategy.fixed,
     default_qty_value=1,
     currency=currency.NONE,
     process_orders_on_close=true)

// === INPUTS ===
zoneLength = input.int(20, "Price Zone Length", minval=5)
profitLockPct = input.float(50, "Profit Lock Percentage", minval=1, maxval=100, step=5) / 100
ticksToLock = input.int(12, "Ticks to Activate Lock", minval=1, tooltip="Number of ticks price must move up to activate tick-based lock")
ticksToSecure = input.int(10, "Ticks to Secure", minval=1, tooltip="Number of ticks to lock in once activated")

// Calculate tick values
tickSize = syminfo.mintick
ticksToLockPoints = ticksToLock * tickSize
ticksToSecurePoints = ticksToSecure * tickSize

// Calculate price zones
h = ta.highest(high, zoneLength)
l = ta.lowest(low, zoneLength)
priceRange = h - l
lvl5 = h
lvl4 = l + (priceRange * 0.75)  // Orange line
lvl3 = l + (priceRange * 0.50)  // Yellow line
lvl2 = l + (priceRange * 0.25)  // Green line
lvl1 = l

// Calculate SMAs
sma19 = ta.sma(close, 19)
sma74 = ta.sma(close, 74)

// Stochastic calculation for color logic
k = ta.stoch(close, high, low, 60)
d = ta.sma(k, 10)

// SMA Color Logic with state tracking
var color currentSMAColor = color.orange
var color previousSMAColor = color.orange
var string currentColorName = "ORANGE"
var string previousColorName = "ORANGE"

smaColor = if d >= 80 or d <= 20
    color.rgb(255, 215, 0)
else if d > d[1]
    color.green
else if d < d[1]
    color.red
else
    color.orange

// Update color state and names
if smaColor != currentSMAColor
    previousSMAColor := currentSMAColor
    currentSMAColor := smaColor
    previousColorName := currentColorName
    currentColorName := if smaColor == color.rgb(255, 215, 0)
        "YELLOW"
    else if smaColor == color.green
        "GREEN"
    else if smaColor == color.red
        "RED"
    else
        "ORANGE"

// Color logic for SMA74
sma74Color = if smaColor == color.rgb(255, 215, 0)
    color.rgb(255, 215, 0)                          
else if sma74 < sma19                               
    color.green
else                                                
    color.red

// === ENTRY CONDITIONS ===
smaIsGreen = smaColor == color.green
greenCandle = close > open
candleAboveOrange = close > lvl4
candleAboveSMA = close > sma19
crossedAboveOrange = ta.crossover(close, lvl4)
smaIsYellow = smaColor == color.rgb(255, 215, 0)

longCondition1 = smaIsGreen and greenCandle and candleAboveOrange and candleAboveSMA and crossedAboveOrange
longCondition2 = smaIsYellow and crossedAboveOrange and candleAboveSMA

// === PROFIT LOCK SYSTEM ===
var float entryPrice = na
var float maxPrice = na
var float profitLockLevel = na
var bool tickLockActivated = false
var float tickBasedLockLevel = na

// Reset variables on new trade entry
if (longCondition1 or longCondition2)
    entryPrice := close
    maxPrice := close
    profitLockLevel := close * (1 - profitLockPct)
    tickLockActivated := false
    tickBasedLockLevel := na

// Update maximum price and profit locks when in a trade
if strategy.position_size > 0
    maxPrice := math.max(maxPrice, high)
    profitLockLevel := math.max(profitLockLevel, maxPrice * (1 - profitLockPct))
    
    // Check if price has moved up enough to activate tick-based lock
    if not tickLockActivated and (maxPrice - entryPrice) >= ticksToLockPoints
        tickLockActivated := true
        tickBasedLockLevel := entryPrice + ticksToSecurePoints

// === EXIT CONDITIONS ===
exitOnYellowLine = close < lvl3
exitOnProfitLock = low < profitLockLevel and strategy.position_size > 0
exitOnTickLock = tickLockActivated and low < tickBasedLockLevel

// === TRADE MANAGEMENT ===
if (longCondition1 or longCondition2)
    strategy.entry("Long", strategy.long)

if strategy.position_size > 0
    if exitOnYellowLine
        strategy.close("Long", comment="Close below yellow")
    if exitOnProfitLock
        strategy.close("Long", comment="Profit lock triggered")
    if exitOnTickLock
        strategy.close("Long", comment="Tick-based lock triggered")

// Plot indicators
plot(sma19, "SMA 19", color=smaColor, linewidth=2)
plot(sma74, "SMA 74", color=sma74Color, linewidth=2)
plot(lvl5, "Upper Zone Top", color=color.red, linewidth=2)
plot(lvl4, "Upper Zone Bottom", color=color.orange, linewidth=2)
plot(lvl3, "Middle Line", color=color.yellow, linewidth=2)
plot(lvl2, "Lower Zone Top", color=color.green, linewidth=2)
plot(lvl1, "Lower Zone Bottom", color=color.blue, linewidth=2)

// Plot profit lock levels
plot(strategy.position_size > 0 ? profitLockLevel : na, "Profit Lock Level", color=color.purple, style=plot.style_linebr, linewidth=2)
plot(strategy.position_size > 0 and tickLockActivated ? tickBasedLockLevel : na, "Tick Lock Level", color=color.fuchsia, style=plot.style_linebr, linewidth=2)

// Fill zones
var p1 = plot(lvl5, display=display.none)
var p2 = plot(lvl4, display=display.none)
var p3 = plot(lvl2, display=display.none)
var p4 = plot(lvl1, display=display.none)
fill(p1, p2, color=color.new(color.red, 90))
fill(p3, p4, color=color.new(color.green, 90))

// Debug Table
if barstate.islast
    var table debugTable = table.new(position.top_right, 2, 13, bgcolor=color.new(color.black, 70), frame_width=1)
    
    table.cell(debugTable, 0, 0, "Current Color", text_color=color.white)
    table.cell(debugTable, 1, 0, currentColorName, text_color=currentSMAColor)
    
    table.cell(debugTable, 0, 1, "Previous Color", text_color=color.white)
    table.cell(debugTable, 1, 1, previousColorName, text_color=previousSMAColor)
    
    table.cell(debugTable, 0, 2, "Entry 1 (Green)", text_color=color.white)
    table.cell(debugTable, 1, 2, str.tostring(longCondition1), text_color=color.white)
    
    table.cell(debugTable, 0, 3, "Entry 2 (Yellow)", text_color=color.white)
    table.cell(debugTable, 1, 3, str.tostring(longCondition2), text_color=color.white)
    
    table.cell(debugTable, 0, 4, "Current Position", text_color=color.white)
    table.cell(debugTable, 1, 4, str.tostring(strategy.position_size), text_color=color.white)
    
    table.cell(debugTable, 0, 5, "Entry Price", text_color=color.white)
    table.cell(debugTable, 1, 5, str.tostring(entryPrice), text_color=color.white)
    
    table.cell(debugTable, 0, 6, "Max Price", text_color=color.white)
    table.cell(debugTable, 1, 6, str.tostring(maxPrice), text_color=color.white)
    
    table.cell(debugTable, 0, 7, "Profit Lock Level", text_color=color.white)
    table.cell(debugTable, 1, 7, str.tostring(profitLockLevel), text_color=color.white)
    
    table.cell(debugTable, 0, 8, "Tick Lock Active", text_color=color.white)
    table.cell(debugTable, 1, 8, str.tostring(tickLockActivated), text_color=color.white)
    
    table.cell(debugTable, 0, 9, "Tick Lock Level", text_color=color.white)
    table.cell(debugTable, 1, 9, str.tostring(tickBasedLockLevel), text_color=color.white)
    
    table.cell(debugTable, 0, 10, "Price Move (Ticks)", text_color=color.white)
    table.cell(debugTable, 1, 10, str.tostring(strategy.position_size > 0 ? (maxPrice - entryPrice) / tickSize : 0), text_color=color.white)
    
    table.cell(debugTable, 0, 11, "Locked Profit %", text_color=color.white)
    table.cell(debugTable, 1, 11, str.tostring(strategy.position_size > 0 ? ((maxPrice - entryPrice) / entryPrice * 100) : 0.0) + "%", text_color=color.white)
    
    table.cell(debugTable, 0, 12, "Exit Signals", text_color=color.white)
    table.cell(debugTable, 1, 12, "Y:" + str.tostring(exitOnYellowLine) + " P:" + str.tostring(exitOnProfitLock) + " T:" + str.tostring(exitOnTickLock), text_color=color.white)