Beberapa indikator teknis strategi pelacakan tren silang: sistem perdagangan kolaboratif RSI dan stokastik RSI

Ringkasan
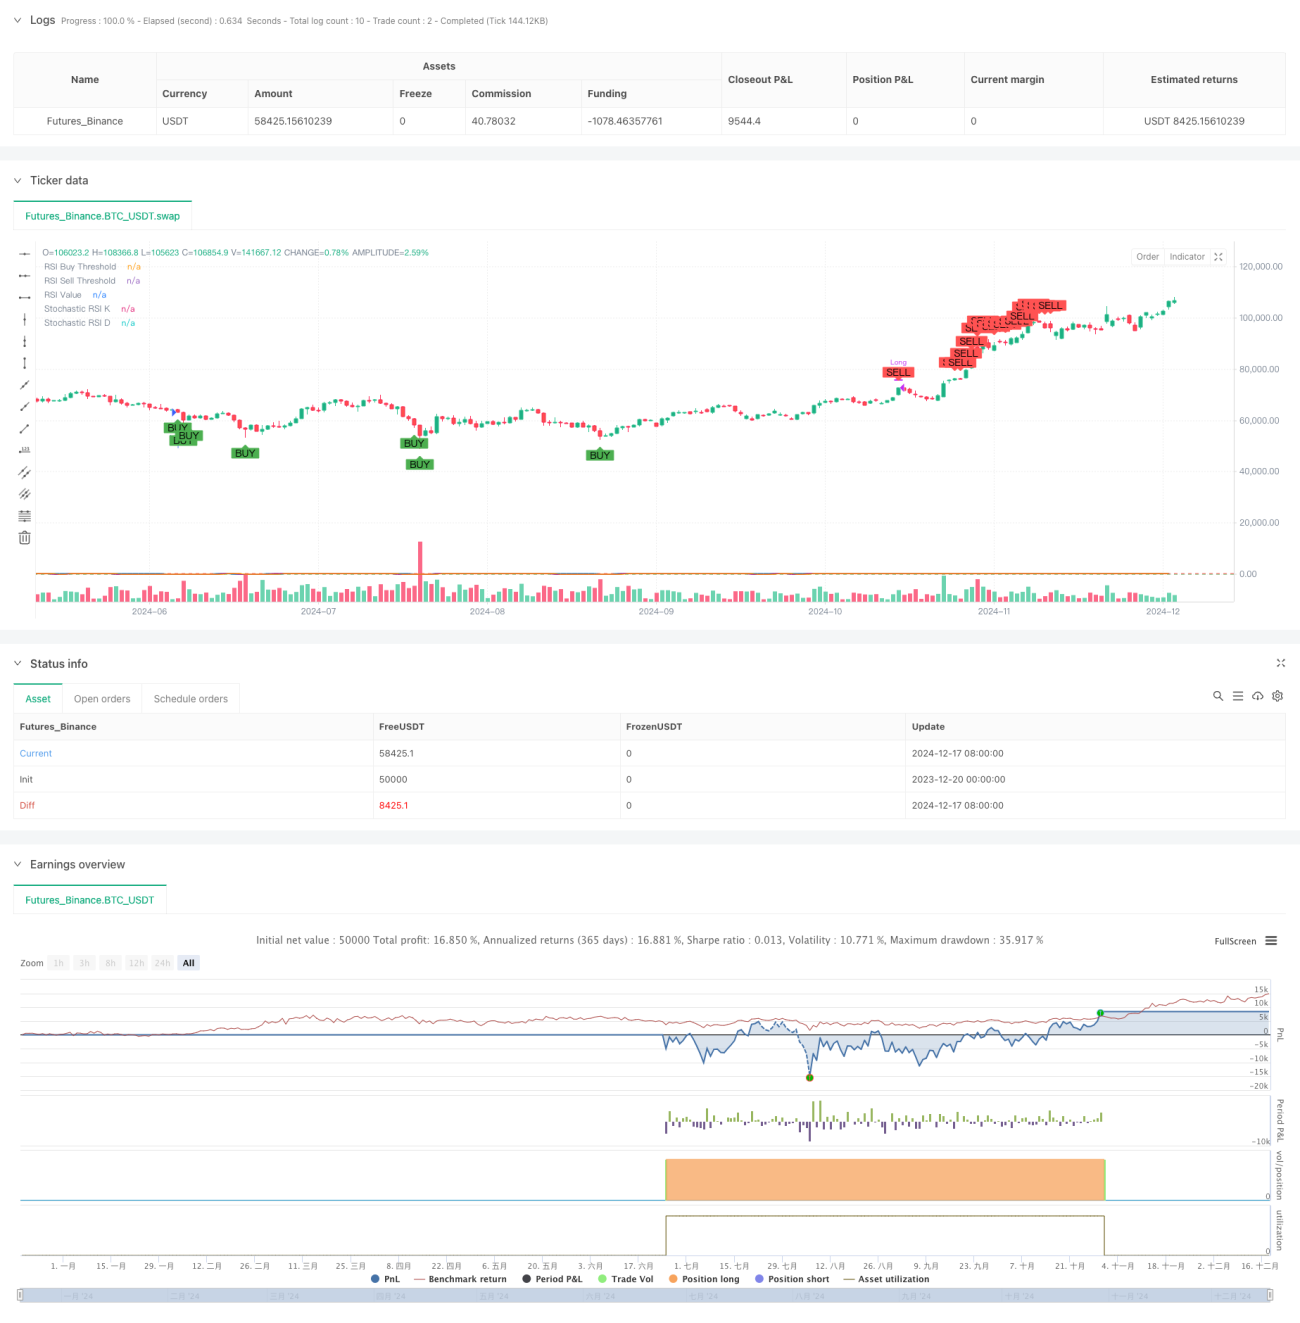
Strategi ini adalah sistem perdagangan yang melacak tren berdasarkan indikator relatif kuat lemah (RSI) dan indikator relatif kuat kuat acak (RSI Stochastic). Strategi ini melakukan perdagangan dengan memantau tingkat overbought dan oversold dari RSI dan RSI Stochastic. Strategi ini didukung untuk beroperasi pada siklus waktu sunset dan mingguan, memberikan pilihan perdagangan yang fleksibel bagi pedagang.
Prinsip Strategi
Strategi ini didasarkan pada dua indikator teknis: RSI dan RSI Stokastik. RSI digunakan untuk mengukur kecepatan dan amplitudo perubahan harga, sedangkan RSI Stokastik memberikan sinyal overbought/oversold yang lebih sensitif melalui perhitungan acak dari nilai RSI. Triggering sinyal beli di RSI di bawah 35 dan K nilai RSI Stokastik di bawah 20 menunjukkan bahwa pasar berada dalam keadaan overbought; Triggering sinyal jual di RSI di atas 70 dan K nilai RSI Stokastik di atas 80 menunjukkan bahwa pasar berada dalam keadaan overbought. Strategi menggunakan rata-rata bergerak ((SMA) untuk meluruskan garis K dan D dari RSI Stokastik, mengurangi sinyal palsu.
Keunggulan Strategis
- Mekanisme double confirmation: Mengurangi dampak sinyal palsu dengan menggabungkan RSI dan Stochastic RSI.
- Siklus waktu yang fleksibel: Dukungan untuk beroperasi pada siklus waktu garis matahari dan garis lingkaran, untuk menyesuaikan dengan gaya perdagangan yang berbeda.
- Parameter yang dapat disesuaikan: Pedagang dapat menyesuaikan parameter RSI dan Stochastic RSI sesuai dengan kondisi pasar.
- Efek visualisasi yang baik: Strategi memberikan tampilan visual yang jelas dari tanda sinyal jual beli dan garis indikator.
- Sistematis: Strategi logis yang jelas, dengan aturan masuk dan keluar yang jelas.
Risiko Strategis
- Risiko pasar bergoyang: sinyal perdagangan yang sering dapat dihasilkan dalam pasar bergoyang horizontal, meningkatkan biaya transaksi.
- Risiko reversal tren: Dalam pasar tren yang kuat, strategi dapat melunasi lebih awal karena sinyal overbought dan oversold, sehingga melewatkan tren besar.
- Sensitivitas parameter: pengaturan parameter yang berbeda dapat menyebabkan hasil transaksi yang berbeda secara signifikan.
- Risiko keterlambatan: Indikator teknis bersifat keterlambatan, yang dapat menyebabkan sedikit penundaan waktu masuk dan keluar.
Arah optimasi strategi
- Menambahkan filter tren: Anda dapat menambahkan indikator tren seperti moving averages untuk melakukan sinyal perdagangan ketika tren jelas.
- Optimalisasi parameter beradaptasi: Mengembangkan mekanisme penyesuaian parameter dinamis, sehingga parameter dapat disesuaikan secara otomatis sesuai dengan volatilitas pasar.
- Meningkatkan mekanisme stop loss: mengatur kondisi stop loss berdasarkan ATR atau persentase tetap, mengendalikan risiko.
- Menambahkan konfirmasi lalu lintas: menggabungkan indikator lalu lintas, meningkatkan keandalan sinyal.
- Mengembangkan penilaian intensitas sinyal: Membangun sistem penilaian intensitas sinyal, menyesuaikan ukuran posisi sesuai dengan intensitas sinyal yang berbeda.
Meringkaskan
Strategi ini membangun sistem perdagangan yang relatif andal dengan menggabungkan keunggulan RSI dan Stochastic RSI. Meskipun ada beberapa keterbatasan, strategi ini memiliki nilai praktis yang baik dengan manajemen risiko yang masuk akal dan pengoptimalan berkelanjutan.
- 1