Strategi perdagangan dinamis adaptif berdasarkan pengembalian logaritmik yang dinormalisasi

Ringkasan
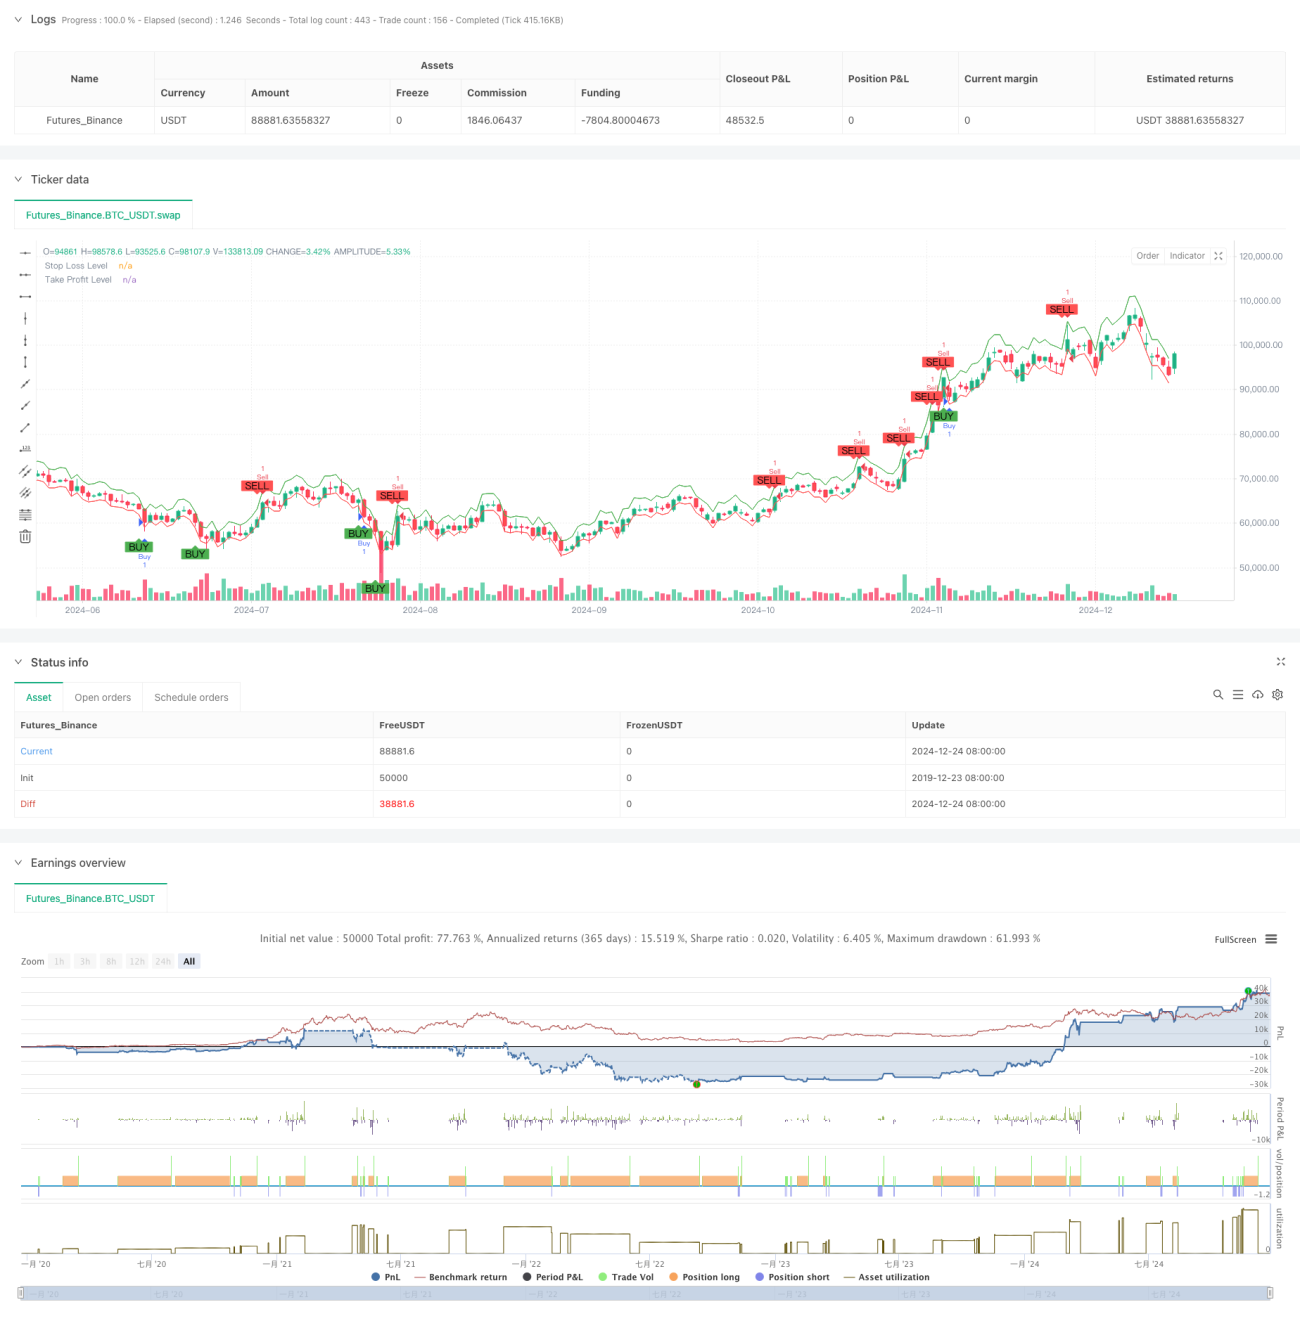
Strategi ini adalah sistem perdagangan adaptif berdasarkan indeks Shiryaev-Zhou (SZI). Strategi ini mengidentifikasi kondisi overbought dan oversold di pasar dengan menghitung skor standar untuk rasio imbal hasil logaritmik, sehingga menangkap peluang harga untuk kembali ke nilai rata-rata. Strategi ini menggabungkan stop loss dan profit target yang dinamis untuk mengendalikan risiko dengan tepat.
Prinsip Strategi
Inti dari strategi ini adalah untuk membangun indikator standar melalui rolling statistical characteristics of logarithmic yields. Langkah-langkahnya adalah sebagai berikut:
- Perhitungan rasio biner untuk mendapatkan perlakuan normal dari rasio
- Perhitungan rata-rata dan standar deviasi dengan jendela 50 periode
- Konstruksi indikator SZI: (Return Logarithm - Rata-rata Bergulir) / Kerugian Standar Bergulir
- Ketika SZI di bawah -2,0 menghasilkan sinyal multitasking, di atas 2,0 menghasilkan sinyal vakum
- Setting 2% stop loss dan 4% stop loss level berdasarkan harga masuk
Keunggulan Strategis
- Dasar teori yang kuat: berdasarkan hipotesis distribusi logaritma normal, dengan dukungan statistik yang baik
- Adaptif: Beradaptasi dengan perubahan karakteristik pasar yang berfluktuasi melalui perhitungan jendela bergulir
- Pengendalian risiko yang sempurna: Strategi peratusan stop loss untuk mengontrol risiko setiap transaksi dengan tepat
- Visibilitas ramah: sinyal perdagangan dan tingkat kontrol risiko ditandai dengan jelas pada grafik
Risiko Strategis
- Sensitivitas parameter: Penentuan panjang dan nilai tipis jendela menelusuri dapat mempengaruhi kinerja strategi secara signifikan
- Ketergantungan pada kondisi pasar: sinyal palsu yang sering terjadi dalam pasar yang sedang tren
- Efek slippage: Pada periode fluktuasi yang kuat, harga transaksi aktual dapat secara signifikan menyimpang dari tingkat yang ideal
- Keterlambatan perhitungan: perhitungan real-time indikator statistik mungkin menghasilkan beberapa sinyal lag
Arah optimasi strategi
- Dynamic Threshold: Dapat dipertimbangkan untuk menyesuaikan sinyal threshold secara dinamis sesuai dengan volatilitas pasar
- Multi-periode waktu: mekanisme konfirmasi sinyal yang memperkenalkan beberapa periode waktu
- Filter volatilitas: menangguhkan perdagangan atau menyesuaikan posisi selama fluktuasi ekstrim
- Konfirmasi sinyal: meningkatkan volume lalu lintas, momentum dan indikator tambahan untuk konfirmasi sinyal
- Manajemen Posisi: Mengimplementasikan manajemen posisi dinamis berdasarkan volatilitas
Meringkaskan
Ini adalah strategi perdagangan kuantitatif yang dibangun di atas dasar statistik yang kuat, menangkap peluang fluktuasi harga dengan keuntungan logis standar. Keunggulan utama strategi ini adalah kemampuan beradaptasi dan pengendalian risiko yang baik, tetapi masih ada ruang untuk pengoptimalan dalam pemilihan parameter dan adaptasi dengan lingkungan pasar.
- 1