Strategi terobosan struktur cerdas TIK berdasarkan kombinasi sinyal dinamis multi-periode waktu

RSI MACD EMA BOS FVG HTF LTF ICT
Tanggal Pembuatan: 2025-01-06 14:09:05 Akhirnya memodifikasi: 2025-01-06 14:09:05
menyalin: 0 Jumlah klik: 456
1
fokus pada
1617
Pengikut

Strategi terobosan struktur cerdas TIK berdasarkan kombinasi sinyal dinamis multi-periode waktu

Ringkasan

Strategi ini adalah sistem perdagangan komprehensif yang menggabungkan berbagai indikator teknis dan ICT (Konsep Perdagangan Institusional). Ini mengintegrasikan indikator analisis teknis tradisional (RSI, indikator stokastik, MACD, EMA) dan konsep perdagangan ICT modern (kesenjangan nilai wajar, terobosan struktural, analisis bias periode waktu tinggi) dalam periode waktu yang berbeda, dan menyaring melalui periode perdagangan yang ketat. Dapatkan pasar yang tepat kontrol akses.

Prinsip Strategi

Strategi ini beroperasi berdasarkan koordinasi lima komponen inti:

  1. Analisis bias periode waktu tinggi: Gunakan rata-rata pergerakan 200 hari untuk menentukan arah tren pasar pada periode waktu yang lebih tinggi
  2. Filter waktu perdagangan: batasi perdagangan ke “zona pembunuhan” tertentu (07:00-10:00)
  3. Identifikasi Kesenjangan Nilai Wajar (FVG): Mengidentifikasi Kesenjangan Struktural di Pasar melalui Tiga Pola Garis K
  4. Penentuan Breakout of Structure (BOS): Terobosan berdasarkan level harga utama mengonfirmasi perubahan arah
  5. Konfirmasi indikator periode waktu rendah: verifikasi ganda menggunakan RSI, indikator stokastik, MACD dan moving average 200

Keunggulan Strategis

  1. Integrasi sinyal multidimensi: Meningkatkan keandalan sinyal dengan menggabungkan beberapa indikator teknis independen dan konsep TIK
  2. Koordinasi siklus waktu: Koordinasi siklus waktu tinggi dan rendah meningkatkan stabilitas sinyal
  3. Penangkapan peluang struktural: Fokus pada peluang perdagangan struktural probabilitas tinggi melalui identifikasi FVG dan BOS
  4. Pengendalian risiko yang sempurna: termasuk mekanisme stop loss dan stop profit, manajemen dana yang terstandarisasi
  5. Optimalisasi waktu perdagangan: Mengurangi gangguan selama jam non-perdagangan melalui penyaringan waktu

Risiko Strategis

  1. Keterlambatan sinyal: Kombinasi beberapa indikator dapat menyebabkan waktu masuk yang tertunda
  2. Kinerja pasar yang tidak menentu: Sinyal palsu sering terjadi di pasar yang bergerak menyamping
  3. Sensitivitas parameter: Pengaturan beberapa parameter indikator memerlukan verifikasi data historis yang memadai
  4. Risiko eksekusi: kombinasi kondisi yang kompleks dapat menyebabkan hilangnya beberapa peluang perdagangan dalam perdagangan nyata
  5. Ketergantungan lingkungan pasar: Kinerja strategi di lingkungan pasar yang berbeda dapat sangat bervariasi

Arah optimasi strategi

  1. Penyesuaian parameter dinamis: menyesuaikan parameter setiap indikator secara adaptif sesuai dengan volatilitas pasar
  2. Klasifikasi lingkungan pasar: Tambahkan modul identifikasi lingkungan pasar dan gunakan kombinasi parameter yang berbeda untuk kondisi pasar yang berbeda
  3. Optimalisasi bobot sinyal: Memperkenalkan metode pembelajaran mesin untuk mengoptimalkan distribusi bobot berbagai indikator
  4. Perluasan periode waktu: tambahkan lebih banyak periode waktu untuk analisis dan tingkatkan keandalan sinyal
  5. Peningkatan pengendalian risiko: Memperkenalkan mekanisme stop-loss yang dinamis dan mengoptimalkan strategi pengelolaan dana

Meringkaskan

Strategi ini membangun sistem perdagangan yang komprehensif dengan mengintegrasikan analisis teknis tradisional dengan konsep TIK modern. Keunggulannya terletak pada konfirmasi sinyal multidimensi dan pengendalian risiko yang ketat, tetapi juga menghadapi tantangan dalam optimalisasi parameter dan kemampuan beradaptasi pasar. Melalui pengoptimalan dan perbaikan berkelanjutan, strategi ini diharapkan dapat mempertahankan kinerja yang stabil di berbagai lingkungan pasar.
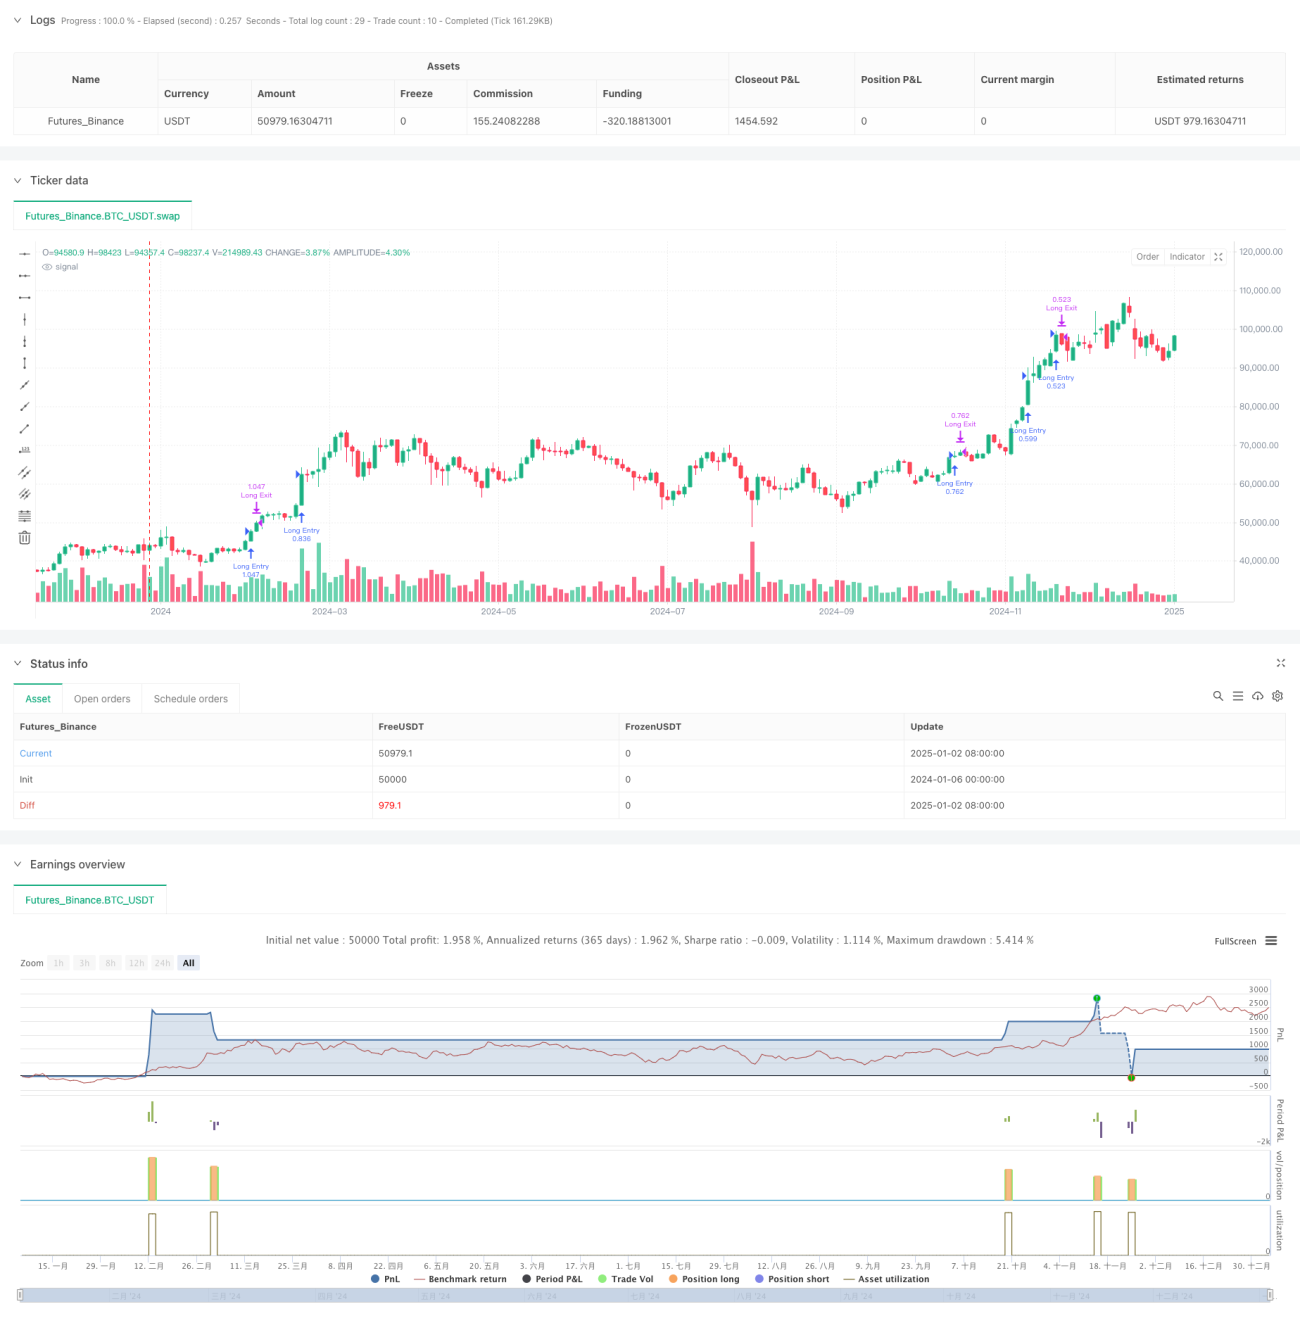
Kode Sumber Strategi
/*backtest
start: 2024-01-06 00:00:00
end: 2025-01-04 08:00:00
period: 2d
basePeriod: 2d
exchanges: [{"eid":"Futures_Binance","currency":"BTC_USDT"}]
*/

// -----------------------------------------------------
// Multi-Signal Conservative Strategy (Pine Script v5)
// + More ICT Concepts (HTF Bias, FVG, Killzone, BOS)
// -----------------------------------------------------
//
// Combines:
// - RSI, Stochastic, MACD, 200 EMA (lower TF)
// - Higher Timeframe (HTF) bias check via 200 EMA
// - Kill Zone time filter
// - Fair Value Gap (FVG) detection (simplified 3-candle approach)
// - Break of Structure (BOS) using pivot highs/lows
// - Only trade markers on chart (no extra indicator plots).
//
// Use on lower timeframes: 1m to 15m
// Always backtest thoroughly and manage risk properly.
//
// -----------------------------------------------------
//@version=5
strategy(title="Multi-Signal + ICT Concepts (HTF/FVG/Killzone/BOS)", shorttitle="ICTStrategyExample",overlay=true, pyramiding=0, initial_capital=10000, default_qty_type=strategy.percent_of_equity, default_qty_value=100)

// -----------------------------------------------------
// User Inputs
// -----------------------------------------------------
/////////////// Lower TF Inputs ///////////////
emaLength       = input.int(200,   "LTF EMA Length",           group="Lower TF")
rsiLength       = input.int(14,    "RSI Length",               group="Lower TF")
rsiUpper        = input.int(60,    "RSI Overbought Thresh",    group="Lower TF", minval=50, maxval=80)
rsiLower        = input.int(40,    "RSI Oversold Thresh",      group="Lower TF", minval=20, maxval=50)
stochLengthK    = input.int(14,    "Stoch K Length",           group="Lower TF")
stochLengthD    = input.int(3,     "Stoch D Smoothing",        group="Lower TF")
stochSmooth     = input.int(3,     "Stoch Smoothing",          group="Lower TF")
macdFast        = input.int(12,    "MACD Fast Length",         group="Lower TF")
macdSlow        = input.int(26,    "MACD Slow Length",         group="Lower TF")
macdSignal      = input.int(9,     "MACD Signal Length",       group="Lower TF")

/////////////// ICT Concepts Inputs ///////////////
htfTimeframe    = input.timeframe("60", "HTF for Bias (e.g. 60, 240)", group="ICT Concepts")
htfEmaLen       = input.int(200,  "HTF EMA Length",                   group="ICT Concepts")
sessionInput    = input("0700-1000:1234567", "Kill Zone Window", group="ICT Concepts")
fvgLookbackBars = input.int(2,    "FVG Lookback Bars (3-candle check)",  group="ICT Concepts", minval=1, maxval=10)

/////////////// Risk Management ///////////////
stopLossPerc    = input.float(0.5, "Stop-Loss %",  step=0.1, group="Risk")
takeProfitPerc  = input.float(1.0, "Take-Profit %", step=0.1, group="Risk")

// -----------------------------------------------------
// 1) Higher Timeframe Bias
// -----------------------------------------------------
//
// We'll request the HTF close, then compute the HTF EMA on that data
// to decide if it's bullish or bearish overall.

htfClose       = request.security(syminfo.tickerid, htfTimeframe, close)
htfEma         = request.security(syminfo.tickerid, htfTimeframe, ta.ema(close, htfEmaLen))
isBullHTF      = htfClose > htfEma
isBearHTF      = htfClose < htfEma

// -----------------------------------------------------
// 2) Kill Zone / Session Filter
// -----------------------------------------------------
//
// We'll only consider trades if the current bar is within
// the user-defined session time (e.g., 07:00 to 10:00 local or exchange time).

isInKillZone = time(timeframe.period, sessionInput) != 0

// -----------------------------------------------------
// 3) Fair Value Gap (FVG) Detection (Simplified)
//
// For a "Bullish FVG" among bars [2], [1], [0]:
//     high[2] < low[0] => there's a gap that bar [1] didn't fill
// For a "Bearish FVG":
//     low[2] > high[0] => there's a gap that bar [1] didn't fill
//
// Real ICT usage might check partial fill, candle bodies vs wicks, etc.
// This is just a minimal example for demonstration.

fvgBarsAgo = fvgLookbackBars // default = 2
bullFVG = high[fvgBarsAgo] < low  // e.g. high[2] < low[0]
bearFVG = low[fvgBarsAgo]  > high // e.g. low[2]  > high[0]

// -----------------------------------------------------
// 4) Break of Structure (BOS)
// -----------------------------------------------------
// Using pivot detection from previous example:

swingLen = 2  // pivot detection length (bars on each side)
// Identify a pivot high at bar [1]
swingHigh = high[1] > high[2] and high[1] > high[0]
// Identify a pivot low at bar [1]
swingLow  = low[1]  < low[2]  and low[1]  < low[0]

// Track the most recent pivot high & low
var float lastPivotHigh = na
var float lastPivotLow  = na

if swingHigh
    lastPivotHigh := high[1]

if swingLow
    lastPivotLow := low[1]

bosUp   = not na(lastPivotHigh) and (close > lastPivotHigh)
bosDown = not na(lastPivotLow)  and (close < lastPivotLow)

// -----------------------------------------------------
// 5) Lower TF Indicator Calculations
// -----------------------------------------------------
ema200      = ta.ema(close, emaLength)  // 200 EMA on LTF
rsiValue    = ta.rsi(close, rsiLength)
kValue      = ta.stoch(high, low, close, stochLengthK)
dValue      = ta.sma(kValue, stochLengthD)
stochSignal = ta.sma(dValue, stochSmooth)
[macdLine, signalLine, histLine] = ta.macd(close, macdFast, macdSlow, macdSignal)

// LTF trend filter
isBullTrend = close > ema200
isBearTrend = close < ema200

// -----------------------------------------------------
// Combine All Conditions
// -----------------------------------------------------
//
// We'll require that all filters line up for a long or short:
//  - HTF bias
//  - kill zone
//  - bullish/bearish FVG
//  - BOS up/down
//  - RSI, Stoch, MACD alignment
//  - Price above/below LTF 200 EMA

longCondition = isInKillZone                     // must be in session
 and isBullHTF                                   // HTF bias bullish
 and bullFVG                                     // bullish FVG
 and bosUp                                       // BOS up
 and (rsiValue > rsiUpper)                       // RSI > threshold
 and (kValue > dValue)                           // stoch K above D
 and (macdLine > signalLine)                     // MACD bullish
 and isBullTrend                                 // above LTF 200 EMA

shortCondition = isInKillZone                    // must be in session
 and isBearHTF                                   // HTF bias bearish
 and bearFVG                                     // bearish FVG
 and bosDown                                     // BOS down
 and (rsiValue < rsiLower)                       // RSI < threshold
 and (kValue < dValue)                           // stoch K below D
 and (macdLine < signalLine)                     // MACD bearish
 and isBearTrend                                 // below LTF 200 EMA

// -----------------------------------------------------
// Strategy Entries
// -----------------------------------------------------
if longCondition
    strategy.entry("Long Entry", strategy.long)

if shortCondition
    strategy.entry("Short Entry", strategy.short)

// -----------------------------------------------------
// Risk Management (Stop-Loss & Take-Profit)
// -----------------------------------------------------
if strategy.position_size > 0
    // Long position exit
    strategy.exit("Long Exit", stop  = strategy.position_avg_price * (1.0 - stopLossPerc/100.0), limit = strategy.position_avg_price * (1.0 + takeProfitPerc/100.0))

if strategy.position_size < 0
    // Short position exit
    strategy.exit("Short Exit",  stop  = strategy.position_avg_price * (1.0 + stopLossPerc/100.0), limit = strategy.position_avg_price * (1.0 - takeProfitPerc/100.0))

// -----------------------------------------------------
// Hide All Indicator Plots
// (We only show trade markers for entry & exit)
// -----------------------------------------------------
// Comment out or remove any plot() calls so chart stays clean.
//
// Example (commented out):
// plot(ema200, title="EMA 200", color=color.new(color.yellow, 0), linewidth=2)
// plot(rsiValue, title="RSI", color=color.new(color.blue, 0))
// plot(macdLine, title="MACD", color=color.new(color.teal, 0))
// plot(signalLine, title="Signal", color=color.new(color.purple, 0))