Strategi kuantitatif crossover rata-rata pergerakan SMA tren jangka panjang

Ringkasan
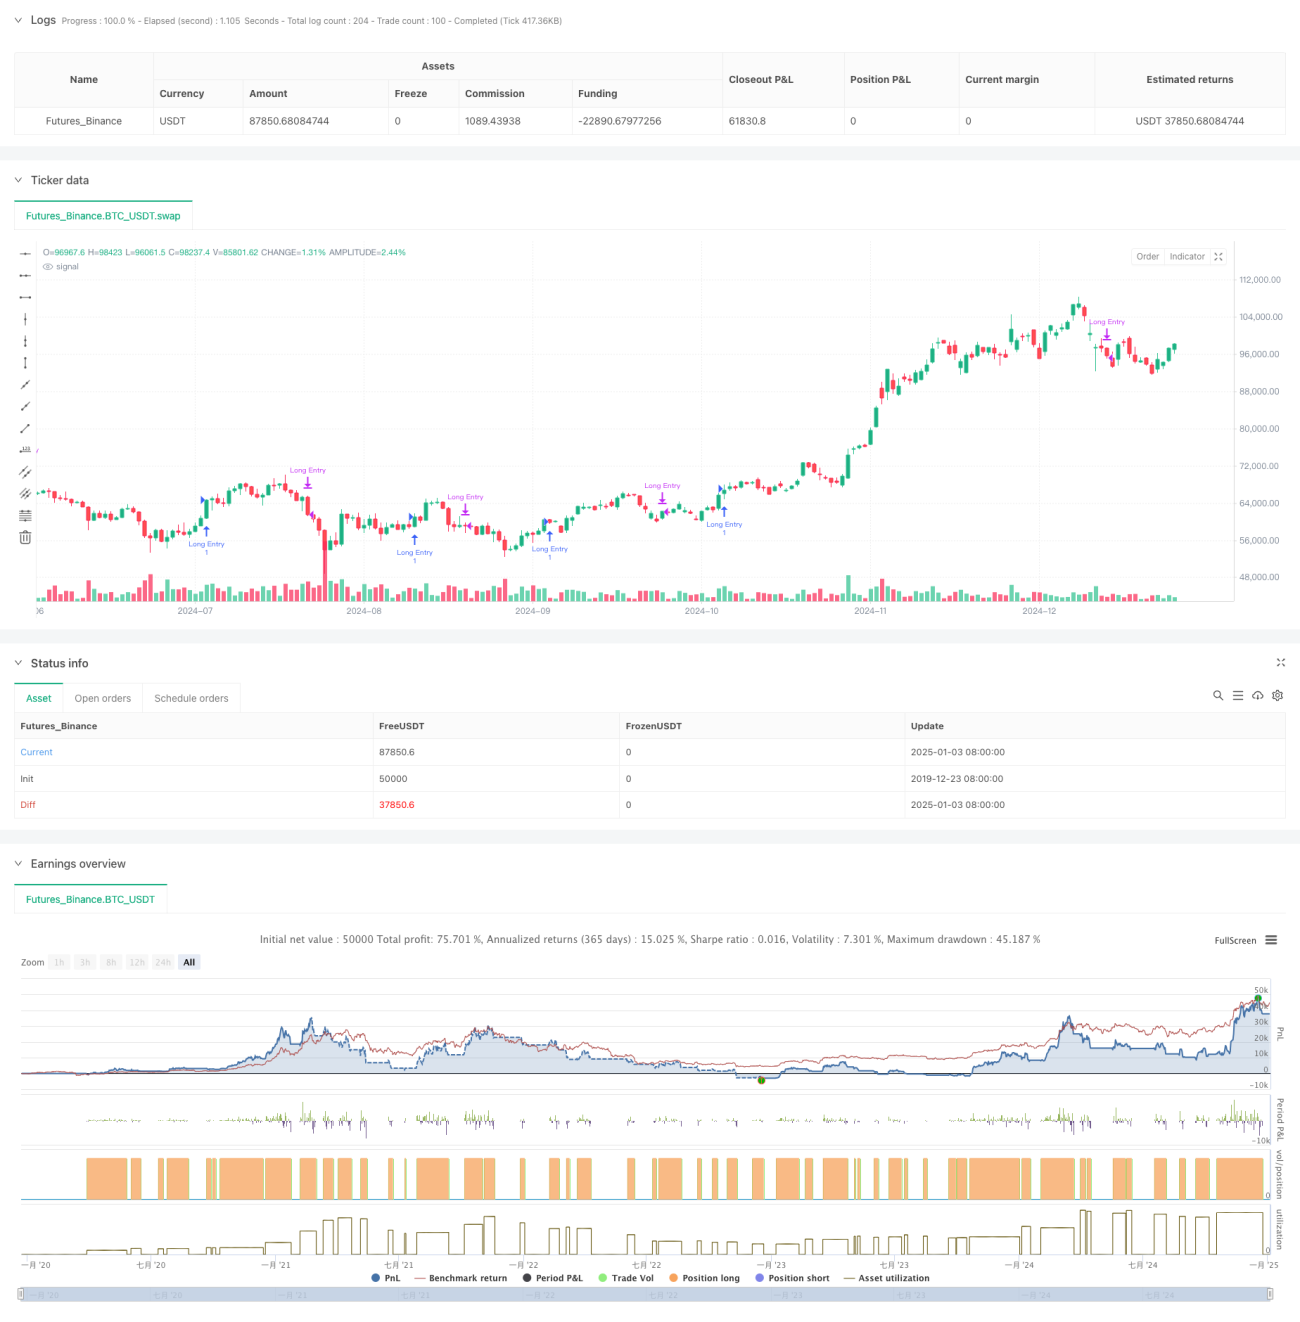
Strategi ini adalah sistem perdagangan kuantitatif berdasarkan sinyal persilangan rata-rata pergerakan sederhana (SMA) multi-periode. Ia terutama berdagang dengan mengidentifikasi peluang kemunduran jangka pendek dalam tren naik jangka panjang. Strategi ini menggunakan indikator SMA dengan lima periode: 5 hari, 10 hari, 20 hari, 60 hari, dan 120 hari untuk menilai tren pasar dan peluang perdagangan melalui hubungan posisi dan sinyal persilangan rata-rata pergerakan.
Prinsip Strategi
Logika inti dari strategi ini mencakup bagian-bagian utama berikut:
- Tren jangka panjang dapat dinilai dari hubungan posisi relatif antara SMA20 dan SMA60. Jika SMA20 berada di atas SMA60, dipastikan bahwa pasar sedang dalam tren naik.
- Atas dasar konfirmasi tren naik jangka panjang, sinyal beli dipicu saat SMA5 jangka pendek pulih dari bawah SMA20 ke atas. Hal ini menunjukkan pasar sedang bangkit kembali setelah kemunduran jangka pendek dalam tren naik.
- Ketika SMA20 melintasi SMA5, sinyal penutupan dipicu. Hal ini menunjukkan bahwa momentum kenaikan jangka pendek telah melemah dan mungkin memasuki periode penyesuaian.
- Strategi ini juga menyertakan fungsi filter waktu, yang dapat membatasi rentang waktu pengujian ulang dan meningkatkan fleksibilitas strategi.
Keunggulan Strategis
- Logika strategi jelas dan sederhana, mudah dipahami dan diterapkan, serta tidak melibatkan proses perhitungan yang rumit.
- Dengan menggunakan beberapa rata-rata pergerakan periode dalam koordinasi, kami dapat secara efektif menyaring gangguan pasar dan meningkatkan keandalan sinyal perdagangan.
- Strategi ini berfokus pada peluang kemunduran di pasar yang sedang tren, yang sejalan dengan konsep inti "perdagangan tren".
- Menggunakan SMA alih-alih EMA mengurangi sensitivitas terhadap perubahan harga dan mengurangi sinyal palsu.
- Logika masuk dan keluar jelas, yang memudahkan eksekusi dan pengendalian risiko.
Risiko Strategis
- Sistem rata-rata bergerak memiliki kelambatan, yang dapat menyebabkan waktu masuk dan keluar yang tidak optimal.
- Dalam pasar yang fluktuatif, persilangan rata-rata pergerakan yang sering terjadi dapat menghasilkan terlalu banyak sinyal palsu.
- Strategi ini tidak memiliki mekanisme penyaringan volatilitas dan mungkin menghadapi risiko penurunan yang lebih besar selama periode volatilitas tinggi.
- Tanpa mempertimbangkan kerja sama indikator teknis lainnya seperti volume perdagangan, keandalan sinyal perlu ditingkatkan.
- Parameter rata-rata pergerakan tetap mungkin tidak cocok untuk semua lingkungan pasar.
Arah optimasi strategi
- Perkenalkan indikator ATR untuk penyaringan volatilitas dan hindari perdagangan saat volatilitas terlalu tinggi.
- Tambahkan mekanisme konfirmasi volume untuk meningkatkan keandalan sinyal perdagangan.
- Mengembangkan mekanisme siklus rata-rata pergerakan adaptif untuk memungkinkan strategi beradaptasi lebih baik terhadap berbagai lingkungan pasar.
- Tambahkan filter kekuatan tren, seperti indikator ADX, untuk memastikan perdagangan dalam tren yang kuat.
- Memperbaiki mekanisme stop-loss, seperti menambahkan trailing stop, untuk mengendalikan risiko dengan lebih baik.
Meringkaskan
Strategi ini menggunakan rata-rata pergerakan SMA multiperiode untuk membangun sistem perdagangan yang berfokus pada penangkapan peluang kemunduran dalam tren naik jangka panjang. Desain strateginya ringkas dan praktis, dengan pemahaman dan penerapan yang baik. Dengan memperkenalkan langkah-langkah pengoptimalan seperti penyaringan volatilitas dan konfirmasi volume, ketahanan dan keandalan strategi diharapkan dapat lebih ditingkatkan.
/*backtest
start: 2019-12-23 08:00:00
end: 2025-01-04 08:00:00
period: 1d
basePeriod: 1d
exchanges: [{"eid":"Futures_Binance","currency":"BTC_USDT"}]
*/

//@version=6
strategy("Long-Term Growing Stock Strategy", overlay=true)
// Date Range
// STEP 1. Create inputs that configure the backtest's date range- 1