Pelacakan tren harga dan volume frekuensi tinggi serta strategi adaptif analisis volume

Ringkasan
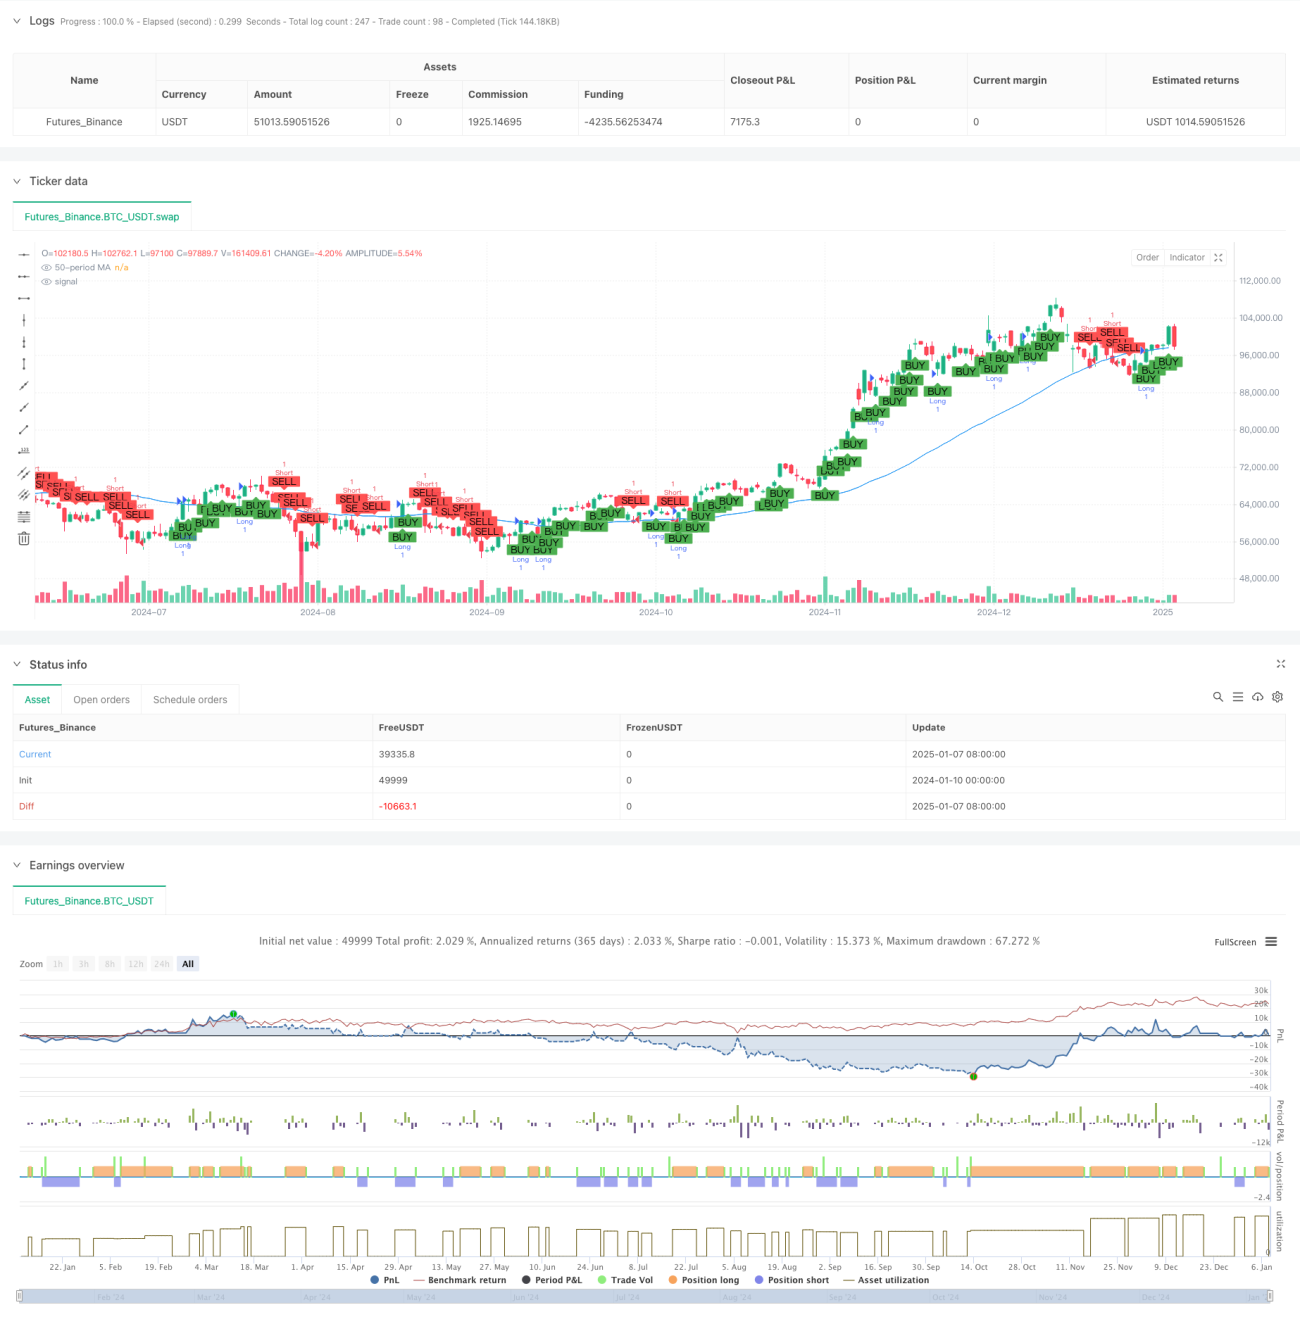
Strategi ini adalah sistem perdagangan otomatis berdasarkan kerangka waktu 5 menit yang menggabungkan metode tren rata-rata pergerakan dan analisis volume. Strategi ini menggunakan rata-rata pergerakan sederhana (SMA) 50 periode untuk menentukan tren pasar dan memperkenalkan analisis volume untuk memverifikasi validitas sinyal perdagangan. Sistem ini menggunakan stop loss dan target keuntungan yang tetap untuk mencapai perdagangan yang sepenuhnya otomatis.
Prinsip Strategi
Logika inti dari strategi ini mencakup komponen-komponen kunci berikut:
- Identifikasi tren: Gunakan SMA periode 50 untuk menentukan arah pasar. Jika harga penutupan lebih tinggi dari moving average, maka dianggap sebagai tren naik, jika tidak maka dianggap sebagai tren turun. Pada saat yang sama, tren harga dalam 30 menit terakhir (6 garis K) digabungkan untuk mengonfirmasi tren.
- Analisis volume: Hitung volume beli dan jual berdasarkan fluktuasi harga, dan alokasikan volume dalam setiap garis K menjadi volume beli dan volume jual sesuai dengan posisi harga penutupan.
- Pembuatan sinyal perdagangan: Dalam tren naik, sinyal panjang dibuat ketika volume beli lebih besar daripada volume jual; dalam tren turun, sinyal pendek dibuat ketika volume jual lebih besar daripada volume beli.
- Pengendalian Risiko: Gunakan stop loss 3% dan target keuntungan 29% untuk mengelola rasio risiko-imbalan setiap perdagangan.
Keunggulan Strategis
- Konfirmasi tren multidimensi: Dengan menggabungkan rata-rata pergerakan dan tren harga jangka pendek untuk mengonfirmasi tren ganda, akurasi penilaian tren ditingkatkan.
- Verifikasi Volume: Perkenalkan analisis volume sebagai filter sinyal perdagangan untuk menghindari penembusan palsu dalam lingkungan volume rendah.
- Manajemen risiko yang sempurna: tetapkan stop loss dan target keuntungan yang jelas untuk mengendalikan risiko satu transaksi secara efektif.
- Kemampuan beradaptasi yang kuat: Strategi dapat secara otomatis menyesuaikan arah transaksi sesuai dengan status pasar dan beradaptasi dengan lingkungan pasar yang berbeda.
Risiko Strategis
- Risiko pasar yang fluktuatif: Sinyal breakout palsu yang sering terjadi dapat terjadi di pasar yang sideways dan fluktuatif, yang menyebabkan stop loss terus-menerus.
- Risiko tergelincir: Dalam perdagangan frekuensi tinggi, Anda mungkin menghadapi tergelincir besar, yang akan memengaruhi efek eksekusi aktual.
- Sensitivitas parameter: Efek strategi sensitif terhadap parameter seperti periode rata-rata pergerakan dan periode perhitungan volume perdagangan.
- Ketergantungan pada lingkungan pasar: Strategi ini berkinerja baik di pasar dengan tren yang jelas, tetapi mungkin mengalami penurunan besar selama periode transisi tren.
Arah optimasi strategi
- Optimalisasi parameter dinamis: Mekanisme parameter adaptif dapat diperkenalkan untuk secara dinamis menyesuaikan periode rata-rata pergerakan dan periode perhitungan volume perdagangan sesuai dengan volatilitas pasar.
- Tingkatkan penyaringan lingkungan pasar: Tambahkan indikator volatilitas atau indikator kekuatan tren untuk secara otomatis menghentikan perdagangan dalam kondisi pasar yang tidak sesuai.
- Meningkatkan mekanisme stop-loss: Stop-loss dinamis, seperti trailing stop-loss atau stop-loss berbasis ATR, dapat digunakan untuk meningkatkan fleksibilitas pengendalian risiko.
- Optimalkan logika pembangkitan sinyal: Pertimbangkan untuk menambahkan lebih banyak indikator teknis untuk validasi silang guna meningkatkan keandalan sinyal.
Meringkaskan
Strategi ini membangun sistem perdagangan frekuensi tinggi yang lengkap dengan menggabungkan pelacakan tren dan analisis volume. Keuntungan utama dari strategi ini terletak pada mekanisme konfirmasi sinyal multidimensi dan sistem pengendalian risiko yang sempurna. Meskipun ada beberapa risiko yang melekat, stabilitas dan kemampuan beradaptasi strategi dapat lebih ditingkatkan melalui arah pengoptimalan yang diusulkan. Strategi ini sangat cocok untuk beroperasi di lingkungan pasar dengan tren yang jelas, dan diharapkan dapat mencapai hasil perdagangan yang stabil melalui optimalisasi parameter dan manajemen risiko yang wajar.
/*backtest
start: 2024-01-10 00:00:00
end: 2025-01-08 08:00:00
period: 1d
basePeriod: 1d
exchanges: [{"eid":"Futures_Binance","currency":"BTC_USDT","balance":49999}]
*/

// This Pine Script™ code is subject to the terms of the Mozilla Public License 2.0 at https://mozilla.org/MPL/2.0/
// © Jerryorange

//@version=6- 1