Pelacakan tren rata-rata pergerakan ganda dan strategi penyaringan volatilitas dinamis

Ringkasan
Strategi ini adalah sistem perdagangan cerdas yang menggabungkan pelacakan tren dan penyaringan volatilitas. Ia mengidentifikasi tren pasar melalui Exponential Moving Average (EMA), menggunakan True Range (TR) dan filter volatilitas dinamis untuk menentukan waktu masuk, dan mengelola risiko dengan mekanisme stop-profit dan stop-loss dinamis berdasarkan volatilitas. Strategi ini mendukung dua mode perdagangan: Scalp dan Swing, yang dapat diubah secara fleksibel sesuai dengan lingkungan pasar dan gaya perdagangan yang berbeda.
Prinsip Strategi
Logika inti dari strategi ini mencakup komponen-komponen kunci berikut:
- Identifikasi Tren: Gunakan EMA periode 50 sebagai penyaring tren dan hanya ambil posisi long ketika harga berada di atas EMA dan ambil posisi short ketika harga berada di bawah EMA.
- Penyaringan Volatilitas: Menghitung EMA dari Rentang Sejati (TR) dan menggunakan faktor filter yang dapat disesuaikan (default 1,5) untuk menyaring kebisingan pasar.
- Kondisi masuk: Dikombinasikan dengan analisis morfologi tiga garis K yang berurutan, pergerakan harga harus terus menerus dan dipercepat.
- Take Profit dan Stop Loss: Dalam mode jangka pendek, ditetapkan berdasarkan TR saat ini; dalam mode band, ditetapkan berdasarkan titik tinggi dan rendah sebelumnya untuk mencapai manajemen risiko yang dinamis.
Keunggulan Strategis
- Kemampuan beradaptasi yang kuat: Melalui kombinasi penyaringan volatilitas dinamis dan pelacakan tren, ia dapat beradaptasi dengan berbagai lingkungan pasar.
- Manajemen risiko yang sempurna: Menyediakan mekanisme stop-profit dan stop-loss yang dinamis untuk dua mode perdagangan, yang dapat dipilih secara fleksibel sesuai dengan karakteristik pasar.
- Penyesuaian parameter yang baik: parameter utama seperti koefisien filter, siklus tren, dll. dapat dioptimalkan sesuai dengan karakteristik produk perdagangan.
- Efek visualisasi yang baik: Menyediakan tanda sinyal beli dan jual yang jelas serta tampilan posisi stop-profit dan stop-loss untuk memudahkan pemantauan transaksi.
Risiko Strategis
- Risiko pembalikan tren: penghentian berturut-turut dapat terjadi pada titik balik tren.
- Risiko breakout palsu: Sinyal palsu dapat dipicu ketika volatilitas tiba-tiba meningkat.
- Sensitivitas parameter: Pengaturan koefisien filter yang tidak tepat dapat menyebabkan sinyal terlalu banyak atau terlalu sedikit.
- Dampak slippage: Di pasar yang cepat, Anda mungkin menghadapi slippage besar, yang dapat memengaruhi kinerja strategi Anda.
Arah optimasi strategi
- Tambahkan penyaringan kekuatan tren: Indikator seperti ADX dapat diperkenalkan untuk mengevaluasi kekuatan tren dan meningkatkan efek pelacakan tren.
- Optimalkan take-profit dan stop-loss: Pertimbangkan untuk memperkenalkan stop-loss bergerak untuk melindungi lebih banyak keuntungan.
- Memperbaiki model perdagangan ayunan: lebih banyak kondisi penilaian khusus perdagangan ayunan dapat ditambahkan untuk meningkatkan kemampuan memegang jangka menengah dan panjang.
- Tambahkan analisis volume: Gabungkan perubahan volume untuk mengonfirmasi validitas terobosan.
Meringkaskan
Strategi ini membangun sistem perdagangan lengkap dengan menggabungkan secara organik pelacakan tren, penyaringan volatilitas, dan manajemen risiko dinamis. Keuntungan dari strategi ini adalah sangat mudah beradaptasi dan risikonya terkendali, sekaligus menyediakan ruang besar untuk pengoptimalan. Dengan menetapkan parameter secara wajar dan memilih mode perdagangan yang tepat, strategi dapat mempertahankan kinerja yang stabil di berbagai lingkungan pasar. Disarankan agar pedagang melakukan pengujian ulang dan pengoptimalan parameter yang memadai sebelum penggunaan waktu nyata, dan membuat penyesuaian yang sesuai berdasarkan karakteristik produk perdagangan tertentu.
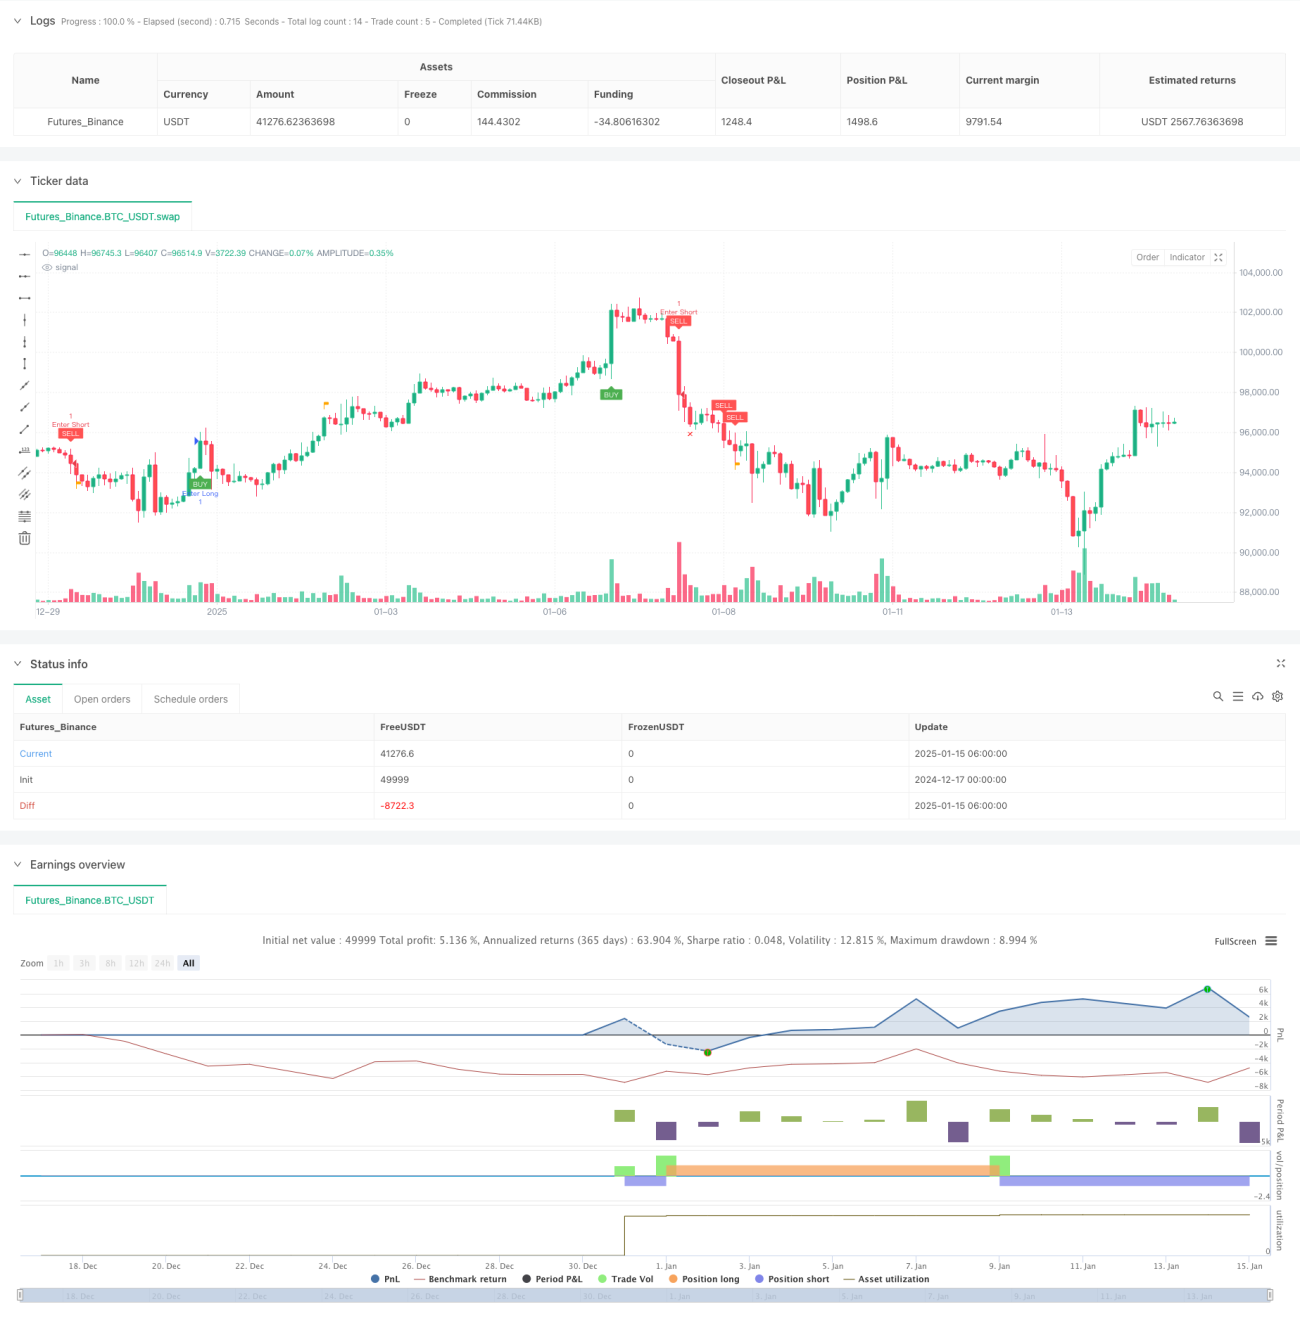
/*backtest
start: 2024-12-17 00:00:00
end: 2025-01-15 08:00:00
period: 2h
basePeriod: 2h
exchanges: [{"eid":"Futures_Binance","currency":"BTC_USDT","balance":49999}]
*/

// This Pine Script™ code is subject to the terms of the Mozilla Public License 2.0 at https://mozilla.org/MPL/2.0/
// © Creativ3mindz

//@version=5- 1