
Ikhtisar
Ini adalah strategi trading kuantitatif yang menggabungkan Relative Strength Index (RSI) dan beberapa moving average. Strategi ini terutama menilai tren pasar dengan memantau sinyal persilangan berbagai jenis moving average (termasuk SMA, EMA, WMA, dan SMMA) pada indikator RSI, serta menggunakan zona overbought dan oversold dari RSI sebagai referensi tambahan untuk menentukan waktu trading.
Prinsip Strategi
Strategi ini mencakup beberapa langkah perhitungan kunci berikut:
- Hitung RSI 14 periode, tetapkan zona overbought di 70 dan zona oversold di 30
- Pada kurva RSI, hitung 3 moving average dengan parameter berbeda:
- MA1: 20 periode, dapat memilih SMA/EMA/WMA/SMMA
- MA2: 50 periode, dapat memilih SMA/EMA/WMA/SMMA
- MA3: 100 periode, dapat memilih SMA/EMA/WMA/SMMA
- Aturan pembuatan sinyal trading:
- Sinyal beli: ketika MA2 melintasi ke atas MA3
- Sinyal jual: ketika MA2 melintasi ke bawah MA3
- Pada saat yang sama, deteksi divergensi RSI sebagai referensi tambahan untuk pengambilan keputusan trading
Keunggulan Strategi
- Validasi silang beberapa indikator teknis meningkatkan keandalan sinyal trading
- Jenis dan parameter moving average dapat disesuaikan, sehingga memiliki fleksibilitas tinggi
- Fitur deteksi divergensi RSI dapat membantu menemukan titik balik pasar lebih awal
- Menggunakan manajemen posisi berbasis persentase, efektif mengendalikan risiko
- Visualisasi yang baik, memudahkan analisis dan backtest
Risiko Strategi
- Persilangan moving average dapat menghasilkan efek lag
- Di pasar yang bergerak sideways, dapat menghasilkan sinyal palsu yang sering
- Distorsi indikator RSI dalam kondisi pasar tertentu
- Pemilihan parameter yang tidak tepat dapat menyebabkan terlalu banyak atau terlalu sedikit sinyal trading
Langkah mitigasi:
- Disarankan untuk melakukan validasi silang dengan pergerakan pasar dan volume perdagangan
- Frekuensi trading dapat dioptimalkan dengan menyesuaikan parameter moving average
- Tetapkan stop loss dan take profit untuk mengendalikan risiko
Arah Optimasi Strategi
- Optimasi penyaringan sinyal:
- Tambahkan indikator konfirmasi tren
- Sertakan analisis volume perdagangan
- Optimasi parameter dinamis:
- Sesuaikan parameter RSI dan MA secara otomatis berdasarkan volatilitas pasar
- Perkenalkan metode perhitungan siklus adaptif
- Optimasi kontrol risiko:
- Kembangkan mekanisme stop loss dan take profit dinamis
- Rancang sistem manajemen posisi dinamis
Kesimpulan
Strategi ini membangun sistem trading yang cukup adaptif dengan menggabungkan RSI dan beberapa moving average. Keunggulan inti strategi terletak pada validasi silang beberapa indikator teknis dan konfigurasi parameter yang fleksibel, namun perlu diperhatikan efek lag dari moving average serta pengaruh kondisi pasar terhadap kinerja strategi. Melalui optimasi berkelanjutan dan kontrol risiko, strategi ini diharapkan dapat memberikan kinerja yang stabil dalam trading aktual.
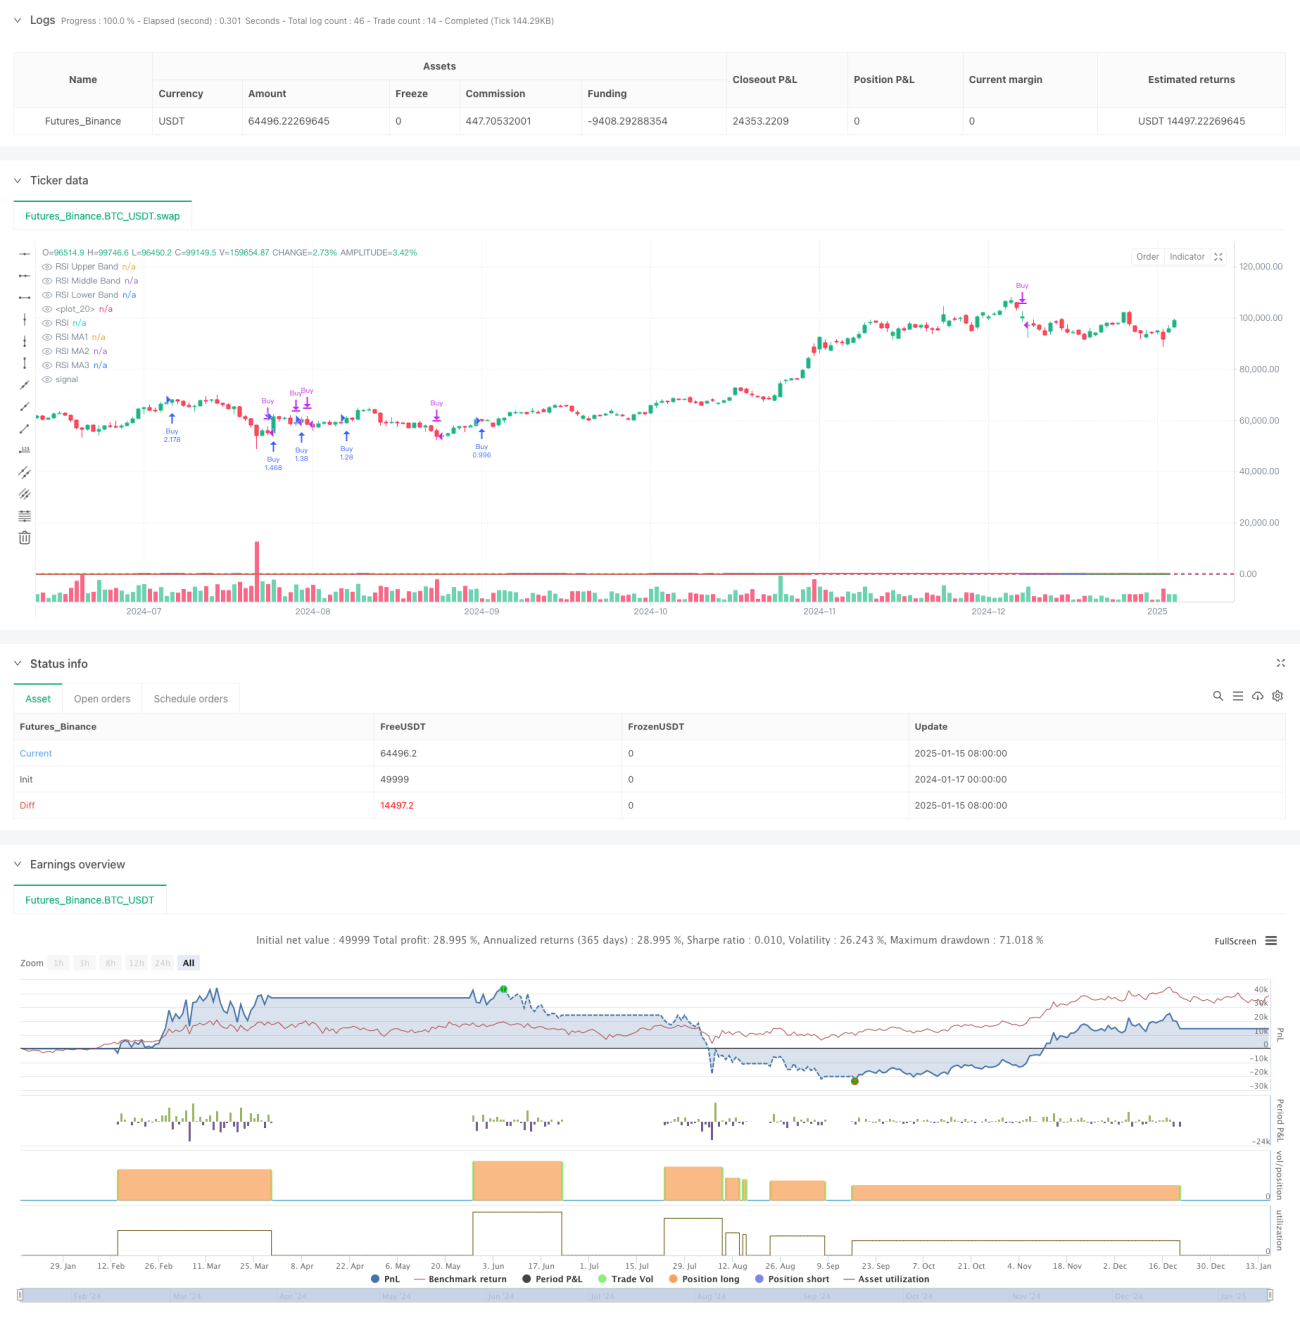
/*backtest
start: 2024-01-17 00:00:00
end: 2025-01-16 00:00:00
period: 1d
basePeriod: 1d
exchanges: [{"eid":"Futures_Binance","currency":"BTC_USDT","balance":49999}]
*/

//@version=6
strategy(title="Relative Strength Index with MA Strategy", shorttitle="RSI-MA Strategy", overlay=true, default_qty_type=strategy.percent_of_equity, default_qty_value=200)

// RSI Inputs- 1