
Ringkasan
Ini adalah strategi pelacakan tren yang didasarkan pada beberapa indikator teknis dan manajemen risiko. Strategi ini secara komprehensif menggunakan beberapa indikator teknis seperti moving average, indikator relatif kuat (RSI), indikator bergerak (DMI) untuk mengidentifikasi tren pasar, dan melindungi keamanan dana melalui pengendalian risiko seperti stop loss dinamis, manajemen posisi, dan pembatasan penarikan maksimum bulanan.
Prinsip Strategi
Strategi ini menggunakan mekanisme pengakuan tren bertingkat-tingkat:
- Arah tren diukur dengan mengamati pergerakan rata-rata (EMA) melalui indeks siklus 8/21/50
- Menggunakan garis tengah saluran harga sebagai filter tren
- Kombinasi RSI rata-rata ((5 siklus) untuk memfilter pergerakan dalam kisaran 35-65 untuk melakukan false breakout
- Kekuatan tren dikonfirmasi melalui indikator DMI (siklus 14)
- Menggunakan indikator momentum ((8 siklus) dan amplifikasi volume transaksi untuk memverifikasi kontinuitas tren
- Menggunakan Stop Loss Dinamis Berbasis ATR untuk Mengontrol Risiko
- Mengimplementasikan manajemen posisi dengan mode risiko tetap dengan margin risiko 5% dari modal awal untuk setiap transaksi
- Tetapkan batas maksimum penarikan bulanan 10% untuk menghindari kerugian yang berlebihan
Keunggulan Strategis
- Verifikasi silang dari beberapa indikator teknis meningkatkan akurasi penilaian tren
- Mekanisme Stop Loss Dinamis Mengontrol Risiko Perdagangan Tunggal
- Manajemen posisi dengan risiko tetap membuat penggunaan dana lebih masuk akal
- Batas penarikan maksimum bulanan memberikan perlindungan terhadap risiko sistematis
- Kombinasi indikator volume pertukaran meningkatkan keandalan pengakuan tren
- Pengaturan Rasio Laba-Rugi 2:1 Meningkatkan Profitabilitas Jangka Panjang
Risiko Strategis
- Penggunaan beberapa indikator dapat menyebabkan keterlambatan sinyal
- Dalam pasar yang bergejolak, sinyal palsu dapat sering muncul.
- Model risiko tetap mungkin tidak cukup fleksibel untuk perubahan besar dalam volatilitas
- Pembatasan penarikan bulanan dapat menyebabkan kehilangan peluang perdagangan penting
- Pada saat itu, ada kemungkinan bahwa tren akan berbalik dan akan mengalami penurunan lebih besar.
Arah optimasi strategi
- Memperkenalkan parameter indikator yang dapat disesuaikan untuk menyesuaikan dengan kondisi pasar yang berbeda
- Mengembangkan strategi manajemen posisi yang lebih fleksibel untuk mempertimbangkan perubahan volatilitas pasar
- Meningkatkan penilaian kuantitatif terhadap intensitas tren, dan mengoptimalkan waktu masuk
- Desain mekanisme pembatasan risiko bulanan yang lebih cerdas
- Menambahkan modul identifikasi lingkungan pasar untuk menyesuaikan parameter strategi dalam kondisi pasar yang berbeda
Meringkaskan
Strategi ini membangun sistem perdagangan pelacakan tren yang relatif lengkap melalui penggunaan komprehensif indikator teknis multi-dimensi. Keunggulan strategi adalah kerangka manajemen risiko yang komprehensif, termasuk stop loss dinamis, manajemen posisi, dan kontrol penarikan. Meskipun ada risiko keterlambatan tertentu, strategi ini diharapkan untuk mempertahankan kinerja yang stabil di berbagai lingkungan pasar melalui optimalisasi dan perbaikan.
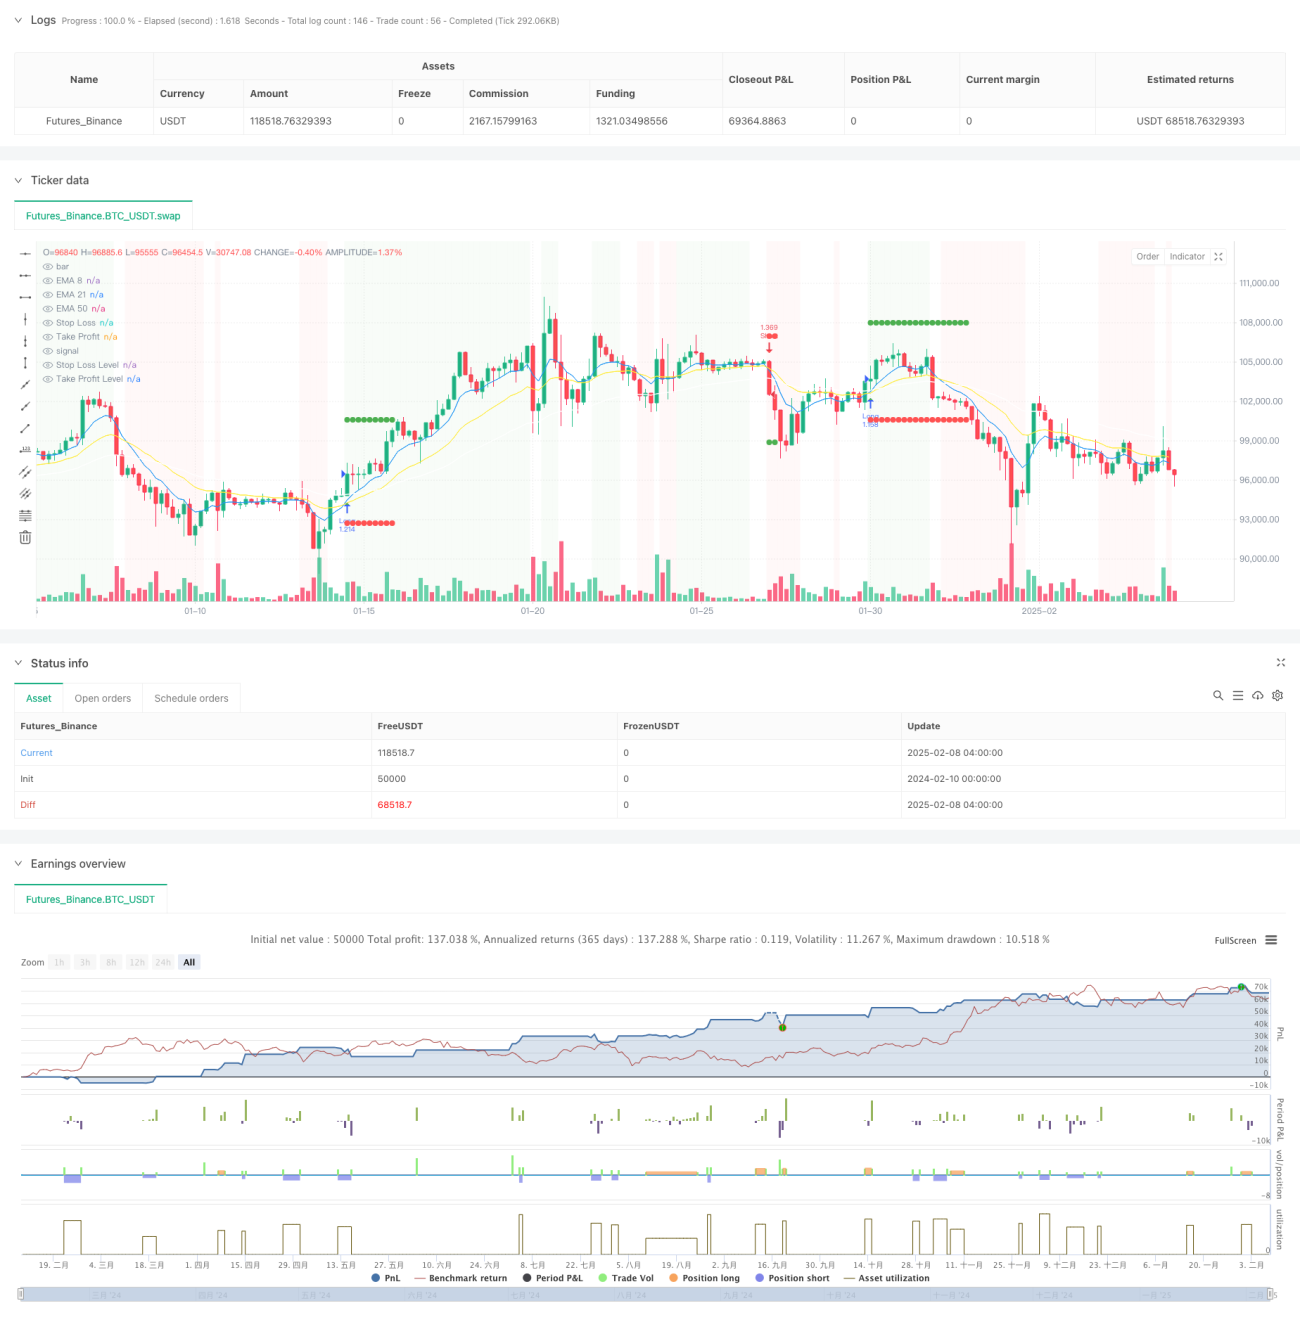
/*backtest
start: 2024-02-10 00:00:00
end: 2025-02-08 08:00:00
period: 4h
basePeriod: 4h
exchanges: [{"eid":"Futures_Binance","currency":"BTC_USDT"}]
*/

//@version=5
strategy("High Win-Rate Crypto Strategy with Drawdown Limit", overlay=true, initial_capital=10000, default_qty_type=strategy.fixed, process_orders_on_close=true)

// Moving Averages- 1