
Ringkasan
Strategi ini adalah sistem perdagangan pelacakan tren inovatif yang menggunakan teknik pengendalian indeks ganda untuk mengidentifikasi tren pasar. Sistem ini menghasilkan dua garis tren dengan pengolahan indeks khusus dari data harga untuk menangkap pergerakan pasar jangka pendek dan jangka panjang. Sistem ini terintegrasi dengan modul manajemen risiko lengkap, termasuk pengaturan stop loss, dan fungsi manajemen posisi yang fleksibel.
Prinsip Strategi
Inti dari strategi ini adalah algoritma penyejukan indeks ganda yang unik. Pertama, sistem memperlakukan harga penutupan dengan bobot, dengan metode menghitung sebagai ((harga tertinggi + harga terendah + 2*Dengan cara ini, dampak dari kebisingan pasar dapat dikurangi. Kemudian, dengan fungsi smoothing indeks yang disesuaikan, kurva smoothing 9 siklus dan 30 siklus dihitung. Sistem akan menghasilkan sinyal perdagangan ketika kurva jangka pendek melintasi kurva jangka panjang.
Keunggulan Strategis
- Mekanisme penciptaan sinyal yang jelas, dengan konsep trend-following klasik, mudah dipahami dan diterapkan.
- Teknologi penyeimbangan indeks ganda dapat secara efektif menyaring kebisingan pasar dan meningkatkan kualitas sinyal.
- Terintegrasi dengan sistem manajemen risiko lengkap, termasuk stop loss dan manajemen posisi.
- Sistem ini dapat beradaptasi dengan lingkungan pasar yang berbeda dan dapat digunakan untuk berbagai jenis transaksi.
- Ini memberikan indikator visual yang jelas, sehingga trader dapat dengan cepat menentukan arah pasar.
Risiko Strategis
- Dalam pasar yang bergejolak, sinyal palsu dapat sering terjadi, yang menyebabkan stop loss berkelanjutan.
- Secara default, 100% dana digunakan untuk perdagangan, dan leverage yang terlalu tinggi dapat membawa risiko yang lebih besar.
- Pengaturan stop loss dengan nilai tetap mungkin tidak cocok untuk semua situasi pasar.
- Sistem dapat mengalami slippage di pasar yang sangat berfluktuasi, yang mempengaruhi efektivitas implementasi.
- Hasil pengujian historis tidak menjamin kinerja di masa depan.
Arah optimasi strategi
- Memperkenalkan indikator volatilitas (seperti ATR) untuk secara dinamis menyesuaikan titik stop loss.
- Menambahkan filter intensitas tren dan mengurangi frekuensi transaksi di bawah kondisi tren yang lemah.
- Tambahkan modul identifikasi lingkungan pasar untuk menyesuaikan parameter strategi secara otomatis di pasar yang bergoyang.
- Mengembangkan sistem manajemen posisi dinamis yang secara otomatis menyesuaikan skala perdagangan sesuai dengan kondisi pasar.
- Terintegrasi dengan modul analisis fundamental untuk meningkatkan keakuratan keputusan perdagangan.
Meringkaskan
Ini adalah sistem pelacakan tren yang dirancang dengan logika yang jelas dan logis. Strategi ini dapat berkinerja baik di pasar yang sedang tren dengan teknik penyejukan indeks ganda dan sistem manajemen risiko yang lengkap. Namun, pengguna perlu menyesuaikan ukuran posisi sesuai dengan toleransi risiko mereka sendiri, dan disarankan untuk melakukan pengujian ulang yang memadai sebelum perdagangan langsung. Dengan arah optimasi yang disarankan, strategi ini masih memiliki ruang untuk ditingkatkan.
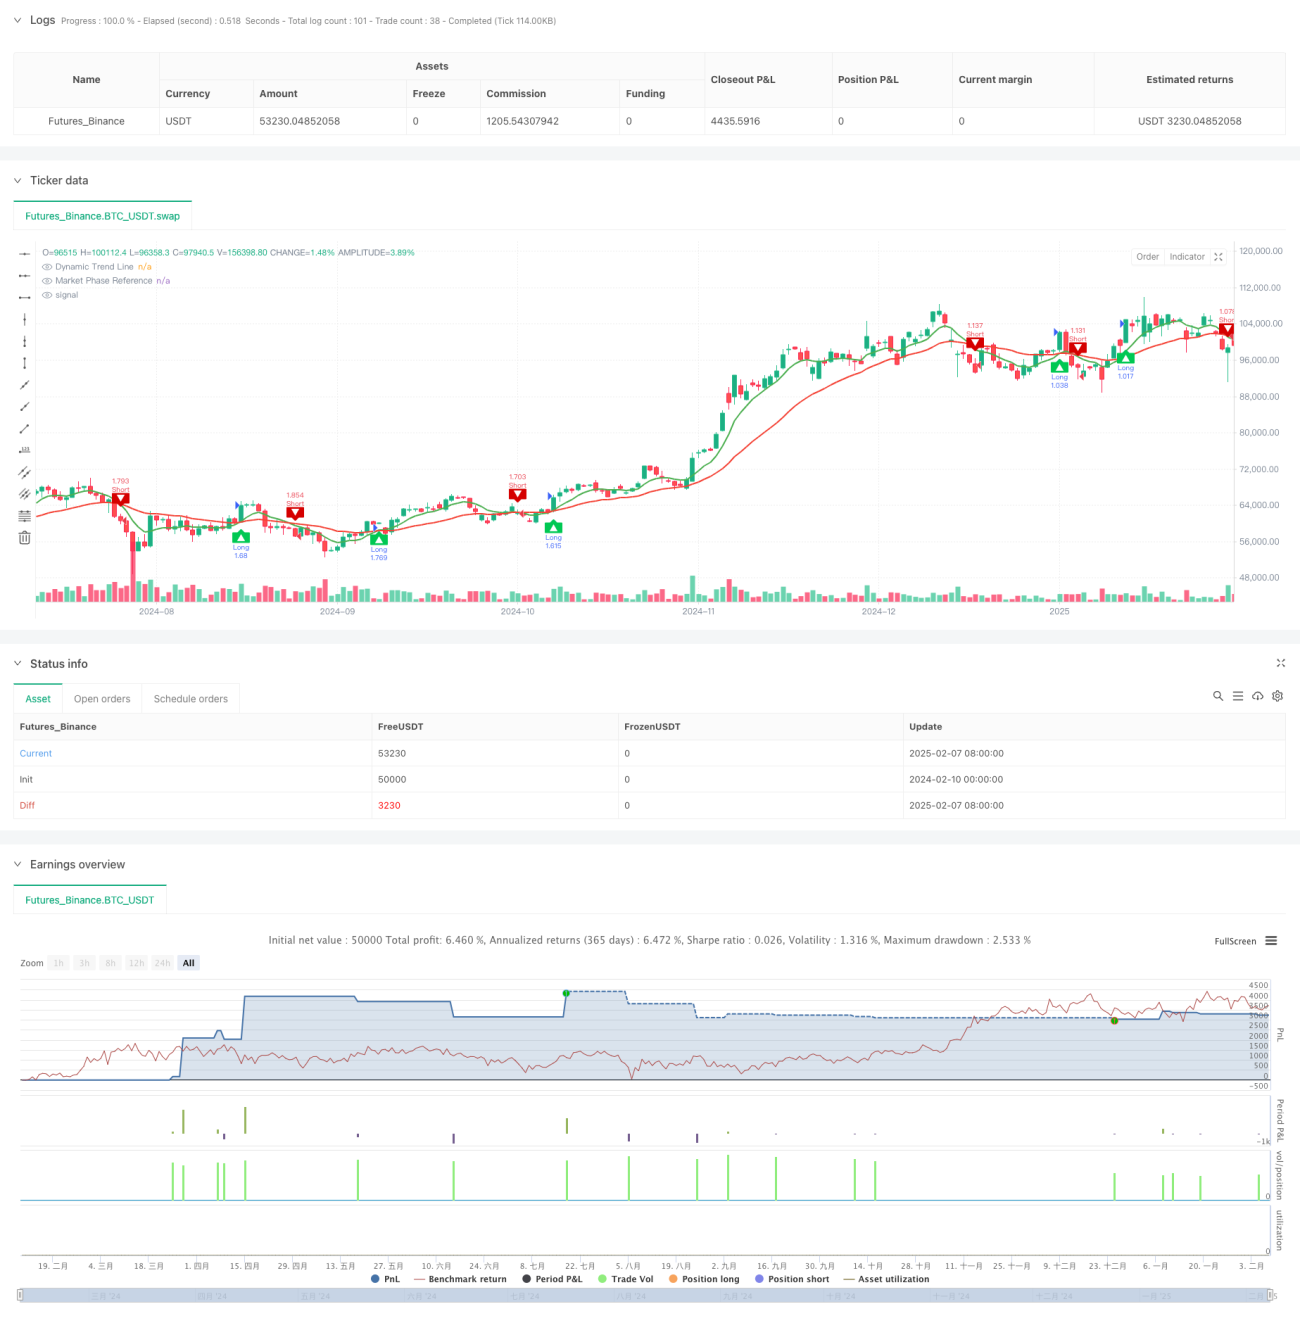
/*backtest
start: 2024-02-10 00:00:00
end: 2025-02-08 08:00:00
period: 1d
basePeriod: 1d
exchanges: [{"eid":"Futures_Binance","currency":"BTC_USDT"}]
*/

//@version=5
strategy("Dynamic Trend Navigator AI [CodingView]", overlay=true, initial_capital=100000, default_qty_type=strategy.percent_of_equity , default_qty_value=200 )
- 1