Strategi Momentum Tren - Sistem Waktu Pita Dinamis Multi-Periode Zigzag

Ringkasan
Strategi ini merupakan sistem perdagangan multidimensi yang menggabungkan indikator ZigZag dan William (%R). Dengan indikator ZigZag, Anda dapat mengidentifikasi titik tinggi dan rendah yang penting, dan menggunakan William untuk mengkonfirmasi titik masuk saat pasar mencapai overbought atau oversold. Kombinasi ini tidak hanya dapat menangkap titik-titik perubahan tren utama di pasar, tetapi juga meningkatkan akurasi perdagangan dengan mengkonfirmasi momentum.
Prinsip Strategi
Logika inti dari strategi ini didasarkan pada dua komponen utama:
- Indikator kata-kata mengidentifikasi titik-titik tinggi dan rendah yang signifikan melalui parameter kedalaman dan defisiensi yang ditetapkan, memfilter kebisingan pasar, dan menentukan arah tren. Ketika titik rendah gelombang baru terbentuk, itu menunjukkan awal tren naik, dan titik tinggi gelombang baru menunjukkan awal tren turun.
- Indikator William menghitung kondisi dinamika pasar dengan membandingkan harga saat ini dengan harga tertinggi dalam periode tertentu. Ketika nilai indikator melampaui 80 berarti oversold (potensi membeli), dan melampaui 20 berarti oversold (potensi menjual).
Aturan trading strategi adalah sebagai berikut:
- Kondisi multi: Indikator kata bentuk mengidentifikasi titik terendah baru dan Indikator William melompat dari zona oversold
- Kondisi kosong: Indikator bentuk kata mengidentifikasi titik tinggi baru dan Indikator William terobosan ke bawah dari zona overbought
- Stop loss di setelan 1% dan stop loss di setelan 2%
Keunggulan Strategis
- Konfirmasi multi-dimensi: meningkatkan keandalan sinyal perdagangan melalui konfirmasi ganda tren dan momentum
- Adaptif: Parameter defisiensi indikator bentuk kata dapat disesuaikan dengan dinamika fluktuasi pasar
- Pengendalian risiko yang sempurna: Menggunakan strategi stop loss dengan persentase tetap untuk mengontrol risiko setiap transaksi
- Efek visualisasi yang baik: menampilkan sinyal perdagangan dengan jelas melalui label dan grafik, untuk memudahkan analisis dan optimalisasi
Risiko Strategis
- Risiko pasar yang bergoyang: sinyal palsu yang sering muncul di pasar horizontal
- Risiko tergelincir: kemungkinan tergelincir lebih besar dalam kondisi kecepatan tinggi
- Sensitivitas parameter: pilihan parameter indikator memiliki pengaruh yang lebih besar terhadap kinerja strategi
- Sinyal lag: mungkin kehilangan beberapa sinyal cepat karena perlu mengkonfirmasi pembentukan titik gelombang baru
Arah optimasi strategi
- Menambahkan filter kondisi pasar: Anda dapat menambahkan indikator volatilitas untuk mengidentifikasi kondisi pasar, menggunakan pengaturan parameter yang berbeda dalam situasi yang berbeda
- Optimasi Stop Loss Dinamis: posisi stop loss dapat disesuaikan secara dinamis berdasarkan ATR atau volatilitas
- Masukkan konfirmasi transaksi: Tambahkan verifikasi transaksi saat sinyal dihasilkan
- Filter waktu: Anda dapat menambahkan filter periode perdagangan untuk menghindari perdagangan pada periode yang lebih berfluktuasi
Meringkaskan
Ini adalah sistem perdagangan lengkap yang menggabungkan pelacakan tren dan perdagangan dinamis. Dengan sinergi dari beberapa indikator teknis, risiko dapat dikendalikan secara efektif sambil mempertahankan tingkat kemenangan yang tinggi. Meskipun ada beberapa keterbelakangan, namun dengan optimasi parameter dan manajemen risiko yang masuk akal, efek perdagangan yang stabil dapat dicapai.
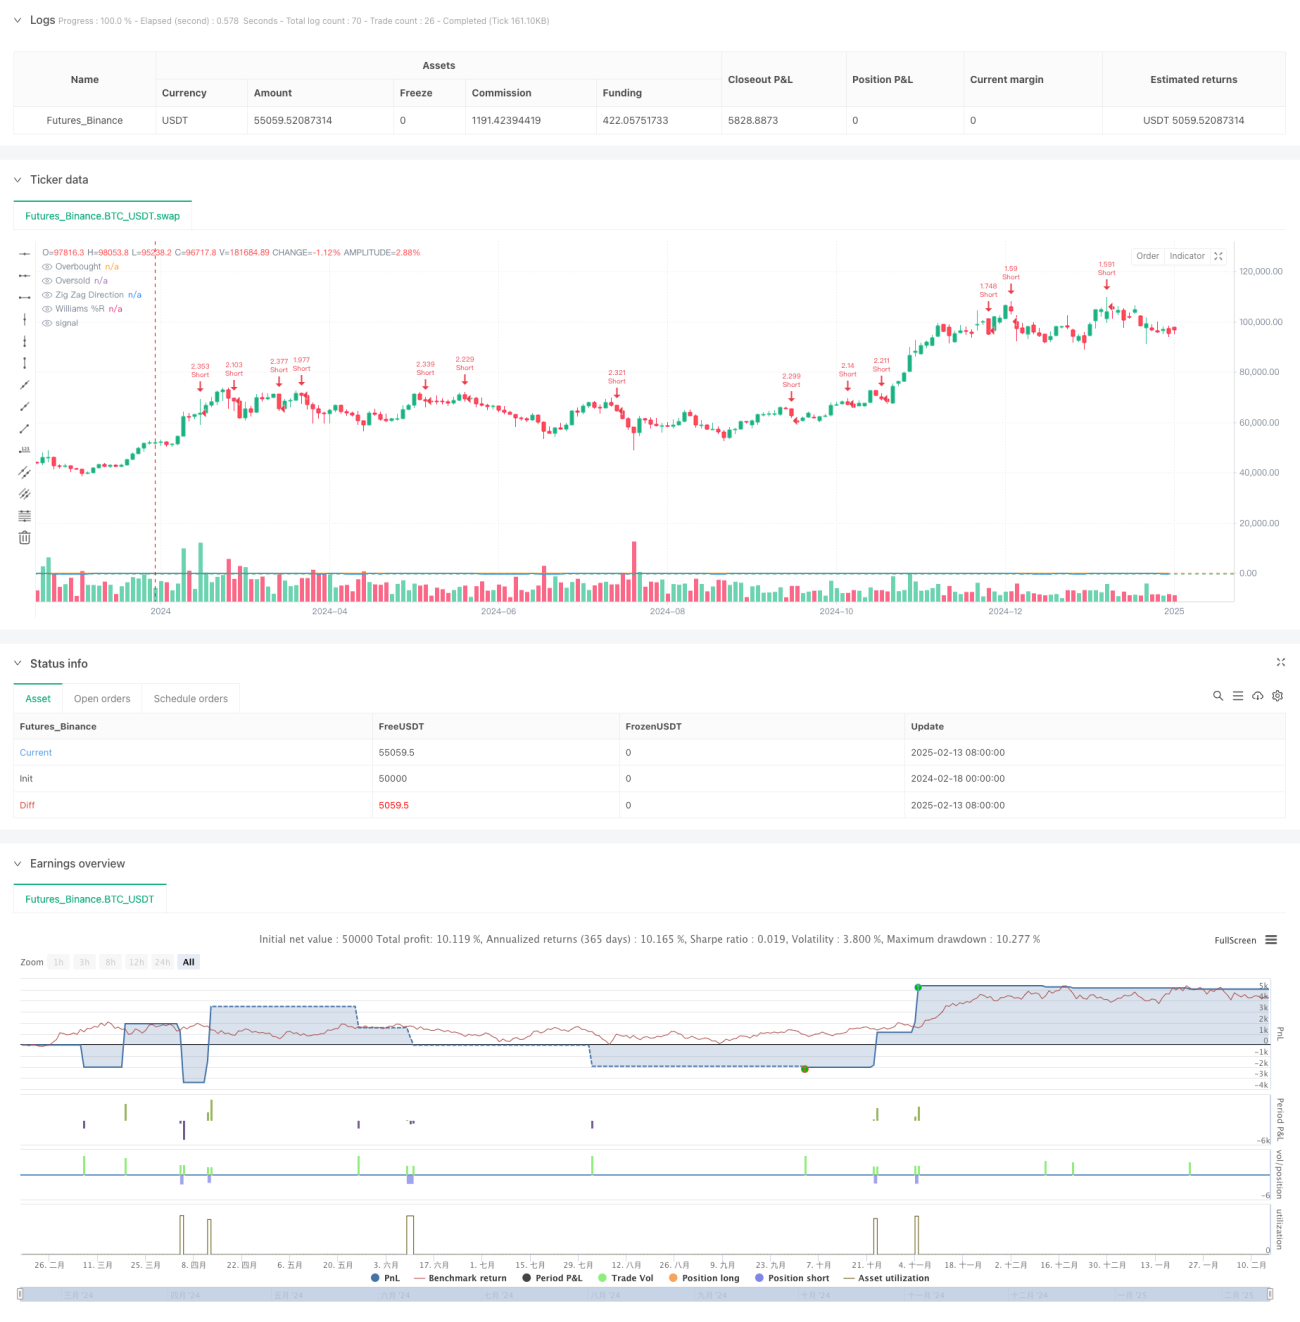
/*backtest
start: 2024-02-18 00:00:00
end: 2025-02-15 08:00:00
period: 2d
basePeriod: 2d
exchanges: [{"eid":"Futures_Binance","currency":"BTC_USDT"}]
*/

//@version=6
strategy("Zig Zag + Williams %R Strategy", overlay=true, default_qty_type=strategy.percent_of_equity, default_qty_value=300)

// ====================- 1