
Ikhtisar
Strategi ini adalah sistem perdagangan yang mengikuti tren berdasarkan Relative Strength Index (RSI) yang ditingkatkan. Strategi ini menghitung versi modifikasi dari RSI dan menggabungkannya dengan garis sinyal untuk menangkap peluang pembalikan tren di berbagai siklus pasar. Selain menghitung nilai indikator, strategi ini juga menampilkan area overbought dan oversold secara visual untuk membantu pedagang menilai kondisi pasar dengan lebih intuitif.
Prinsip Strategi
Prinsip inti strategi ini adalah mengidentifikasi tren pasar melalui perhitungan Enhanced RSI (ARSI). Secara spesifik meliputi:
- Menghitung harga tertinggi dan terendah dalam periode tertentu untuk mendapatkan rentang harga
- Menghitung selisih berdasarkan perubahan harga
- Menggunakan metode rata-rata bergerak yang dapat dipilih (EMA, SMA, RMA, TMA) untuk menghaluskan selisih
- Menstandarisasi hasil ke dalam rentang 0-100
- Menghasilkan sinyal beli ketika ARSI melintasi garis sinyal di bawah 50
- Menghasilkan sinyal jual ketika ARSI menembus ke bawah garis sinyal di atas 50
Keunggulan Strategi
- Mekanisme konfirmasi sinyal yang baik – melalui persilangan ARSI dengan garis sinyal dan filtrasi sumbu tengah, memastikan keandalan sinyal
- Adaptabilitas tinggi – mendukung berbagai metode rata-rata bergerak yang dapat disesuaikan dengan karakteristik pasar yang berbeda
- Manajemen risiko yang wajar – menggunakan metode manajemen persentase posisi untuk mengendalikan risiko setiap perdagangan secara efektif
- Visualisasi yang menonjol – menampilkan area overbought dan oversold dengan jelas melalui pengisian warna, memudahkan penilaian cepat
- Manajemen posisi terbalik – ketika sinyal berlawanan muncul, posisi yang ada akan ditutup secara otomatis untuk menghindari risiko posisi dua arah
Risiko Strategi
- Risiko pasar berombak – dapat menghasilkan sinyal palsu yang sering terjadi dalam kondisi pasar sideways
- Risiko keterlambatan – karena menggunakan perhitungan rata-rata bergerak, sinyal mengalami sedikit keterlambatan
- Sensitivitas parameter – pengaturan parameter yang berbeda dapat menyebabkan perbedaan kinerja strategi yang signifikan
- Risiko adaptasi pasar – kinerja strategi dapat berbeda secara signifikan di berbagai kondisi pasar
- Risiko manajemen modal – manajemen posisi persentase tetap dapat menimbulkan risiko besar saat volatilitas tinggi
Arah Optimasi Strategi
- Memperkenalkan filter volatilitas – dapat menambahkan indikator ATR untuk menyaring sinyal perdagangan di lingkungan volatilitas rendah
- Menambahkan indikator konfirmasi tren – menggabungkan indikator tren jangka panjang yang lebih panjang untuk meningkatkan keandalan sinyal
- Mengoptimalkan manajemen posisi – menyesuaikan proporsi posisi secara dinamis berdasarkan volatilitas pasar
- Menambahkan mekanisme stop loss – menetapkan stop loss dinamis berdasarkan ATR untuk mengontrol risiko dengan lebih baik
- Mengembangkan parameter adaptif – meneliti metode optimasi parameter dinamis untuk meningkatkan adaptabilitas strategi
Kesimpulan
Ini adalah strategi yang terstruktur dengan baik dan logis untuk mengikuti tren. Melalui metode perhitungan inovatif RSI yang ditingkatkan, dikombinasikan dengan kelebihan berbagai indikator teknis, terbentuklah sistem perdagangan yang andal. Meskipun terdapat beberapa risiko inheren, melalui optimasi yang wajar dan langkah-langkah manajemen risiko, strategi ini memiliki prospek aplikasi praktis yang baik. Disarankan agar pedagang, saat menggunakan secara langsung, menguji pengaturan parameter secara menyeluruh dan menyesuaikan konfigurasi strategi sesuai dengan kondisi pasar.
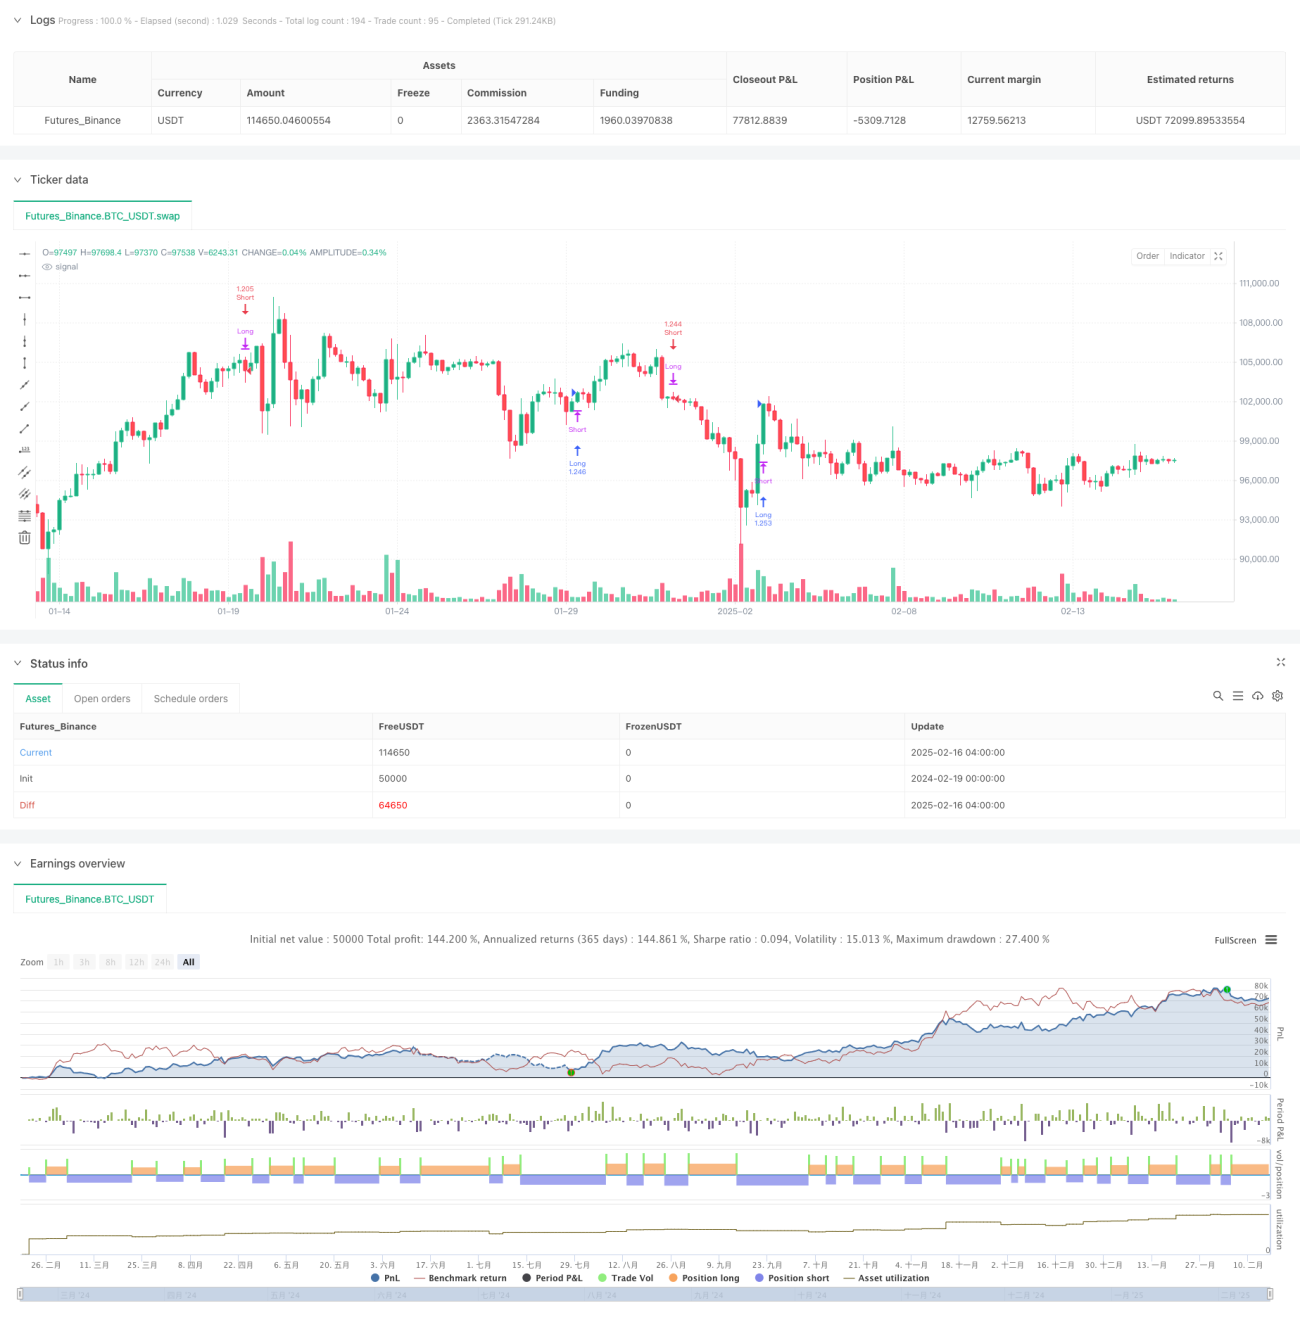
/*backtest
start: 2024-02-19 00:00:00
end: 2025-02-16 08:00:00
period: 4h
basePeriod: 4h
exchanges: [{"eid":"Futures_Binance","currency":"BTC_USDT"}]
*/

//@version=6
strategy("Ultimate RSI [LuxAlgo] Strategy", shorttitle="ULT RSI Strat", overlay=false, initial_capital=10000, currency=currency.USD, default_qty_type=strategy.percent_of_equity, default_qty_value=100)

//------------------------------------------------------------------------------- 1