
Ringkasan
Ini adalah strategi perdagangan terobosan yang didasarkan pada perilaku harga murni, dirancang dengan rasio pengembalian risiko tinggi 1: 5. Strategi ini melakukan perdagangan dengan mengidentifikasi terobosan pada tingkat harga kunci, dan dalam kombinasi dengan struktur pasar yang dinamis untuk menetapkan tujuan stop loss dan profit. Strategi ini tidak bergantung pada indikator teknis apa pun dan membuat keputusan perdagangan sepenuhnya berdasarkan perilaku harga real-time.
Prinsip Strategi
Logika inti dari strategi ini mencakup bagian-bagian utama berikut:
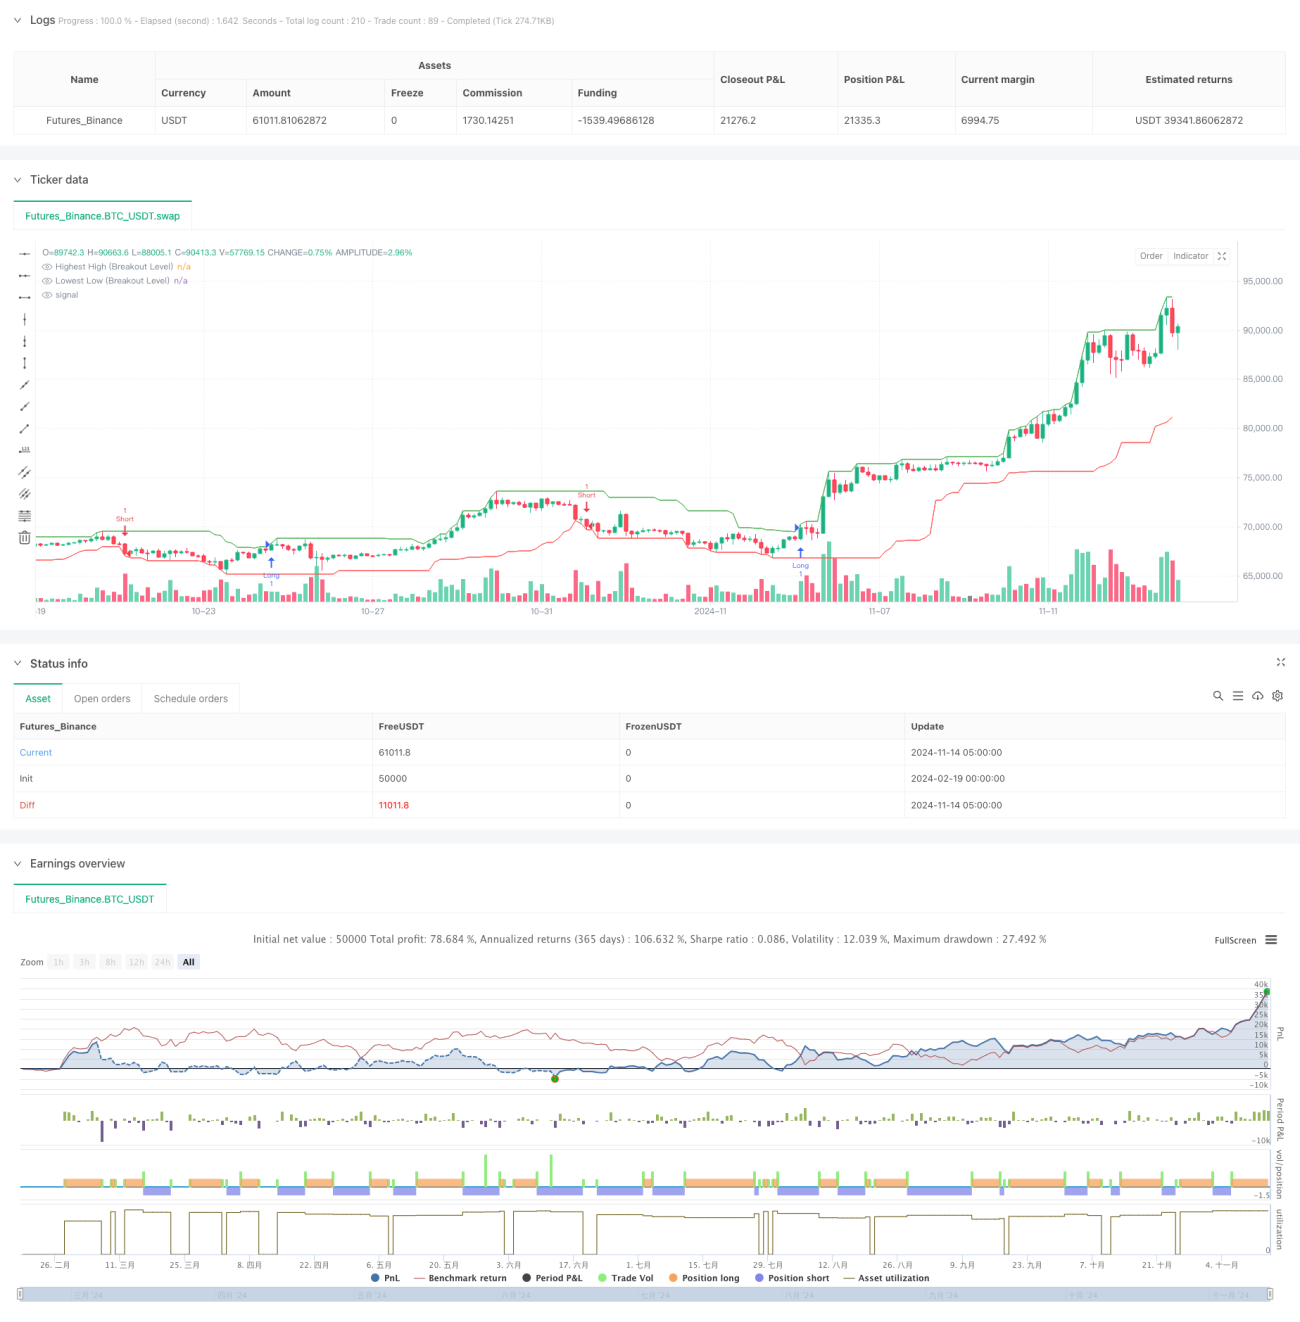
- Membentuk titik acuan untuk terobosan dengan mengidentifikasi harga tertinggi dan terendah pada periode yang telah dilalui
- Buka posisi over saat harga close breaks dari high sebelumnya, buka posisi kosong saat breaks dari low sebelumnya
- Berdasarkan posisi stop loss yang dinamis dengan posisi volatilitas terkini, posisi multi-posisi dengan posisi stop loss pada titik rendah, posisi kosong dengan posisi stop loss pada titik tinggi
- Posisi target keuntungan dihitung berdasarkan rasio risiko-pengembalian 1: 5
- Tetapkan batas maksimum transaksi per hari untuk menghindari over-trading
Seluruh proses perdagangan didasarkan pada perilaku harga, tanpa menggunakan indikator teknis sebagai referensi.
Keunggulan Strategis
- Perdagangan dengan perilaku harga murni, menghindari gangguan dari keterlambatan indikator
- Desain dengan tingkat pengembalian risiko tinggi, keuntungan potensial dari setiap transaksi adalah 5 kali risiko
- Pengaturan Stop Loss Dinamis, Adaptasi Sesuai Struktur Pasar
- Sinyal perdagangan yang jelas dan tanda-tanda visual untuk memudahkan transaksi
- Parameter sangat dapat disesuaikan untuk beradaptasi dengan lingkungan pasar yang berbeda
- Kontrol risiko yang ketat, termasuk pembatasan jumlah transaksi per hari
Risiko Strategis
- Dalam pasar yang bergejolak, sinyal-sinyal palsu yang sering muncul
- Tingkat risiko yang tinggi dapat menyebabkan tingkat kemenangan yang relatif rendah
- Pembalikan setelah terobosan dapat memicu stop loss
- Perubahan volatilitas pasar dapat mempengaruhi kinerja strategi
- Pergeseran harga yang lebih besar diperlukan untuk mencapai target keuntungan.
Tindakan mitigasi:
- Menggunakan strategi ini di pasar tren
- Hindari transaksi selama siaran pers penting
- Skala posisi yang masuk akal
- Parameter yang harus diperiksa dan dioptimalkan
Arah optimasi strategi
- Menambahkan filter tren, hanya berdagang di arah tren utama
- Menambahkan mekanisme konfirmasi pengiriman untuk meningkatkan keandalan terobosan
- Rasio risiko-return yang disesuaikan dengan dinamika fluktuasi
- Memperkenalkan analisis siklus waktu ganda untuk meningkatkan akurasi transaksi
- Mengembangkan mekanisme stop loss yang lebih cerdas, seperti tracking stop loss
- Menambahkan kemampuan untuk mengidentifikasi kondisi pasar, menyesuaikan parameter strategi
Meringkaskan
Ini adalah strategi perdagangan perilaku harga yang dirancang dengan ketat, logika yang jelas. Dengan desain rasio pengembalian risiko yang tinggi, mengejar keuntungan yang signifikan sambil mengontrol risiko secara efektif. Keunggulan strategi adalah didorong oleh harga murni, parameter yang fleksibel dan dapat disesuaikan, kontrol risiko yang sempurna.
- 1