Penilaian tren rata-rata pergerakan multi-periode dan strategi RSI overbought

Ringkasan
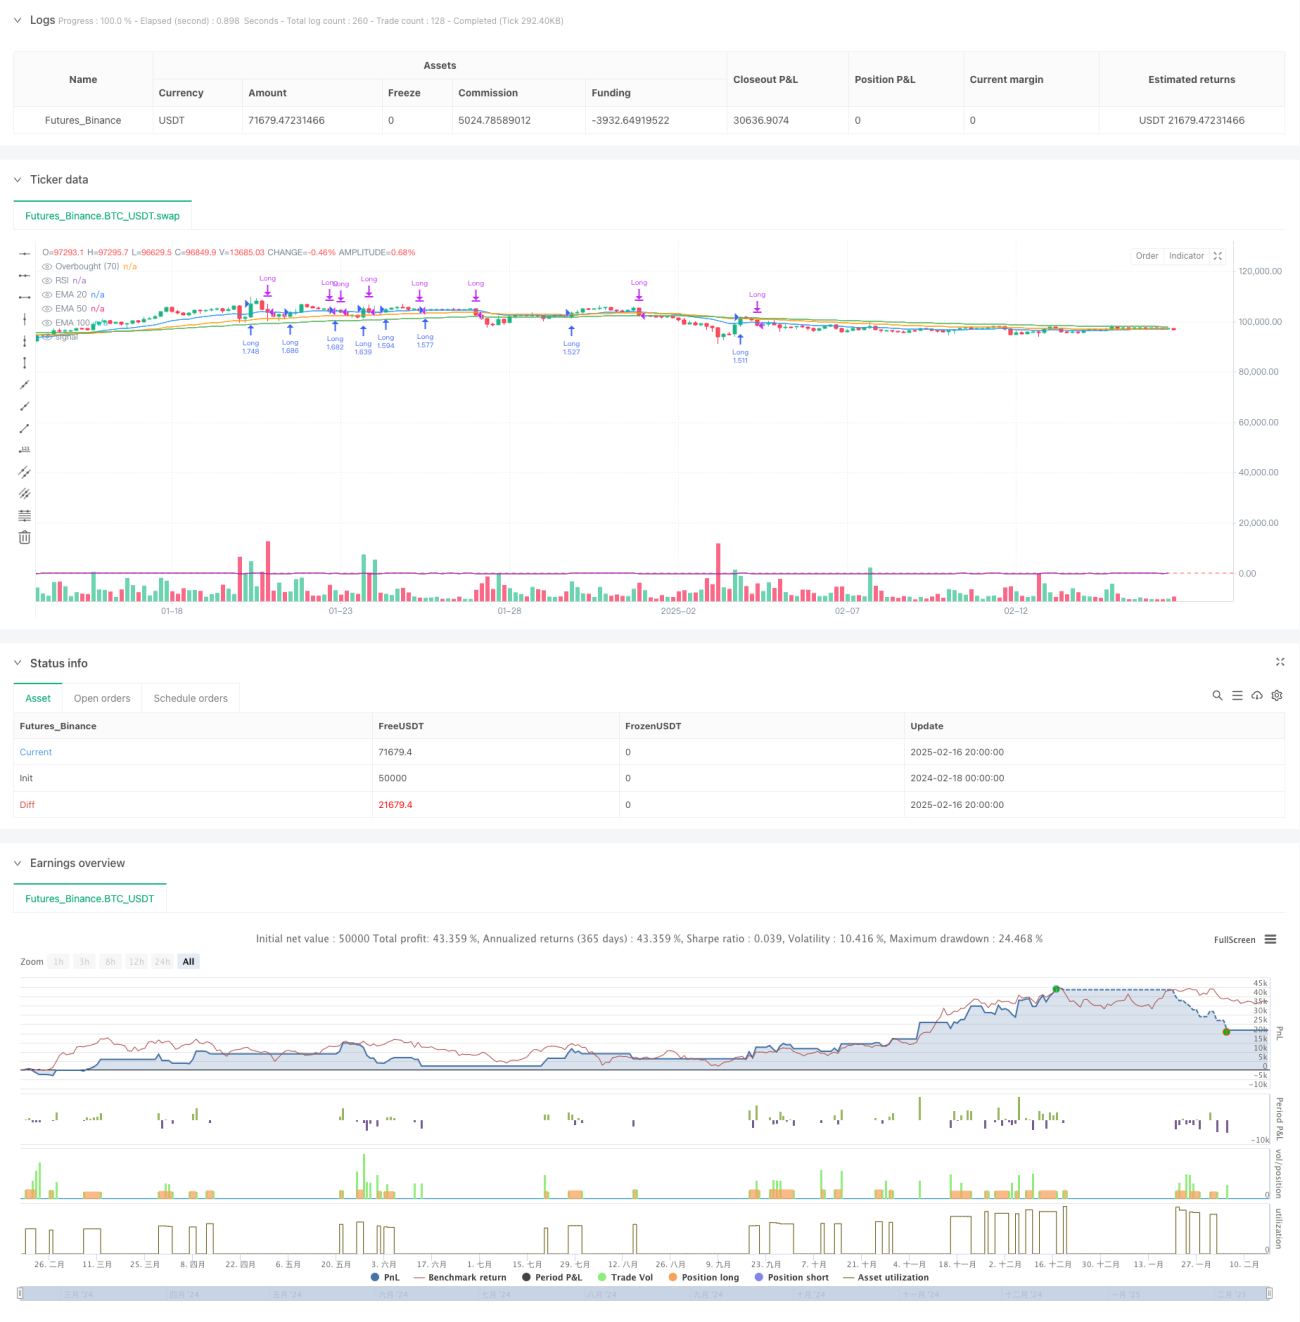
Strategi ini adalah sistem perdagangan untuk melacak tren berdasarkan rata-rata bergerak indeks multi-periode (EMA) dan indikator yang relatif kuat (RSI). Strategi ini membuat keputusan perdagangan dengan menilai tren EMA tiga periode 20, 50, 100 dengan kombinasi sinyal overbought harga dan RSI. Strategi ini terutama berlaku untuk pasar tren dan meningkatkan akurasi perdagangan dengan verifikasi beberapa indikator teknis.
Prinsip Strategi
Logika inti dari strategi ini mencakup bagian-bagian utama berikut:
- Penghakiman tren: menilai apakah rata-rata tiga periode ((20/50/100) berada dalam tren naik dengan membandingkan nilai EMA saat ini dengan periode sebelumnya
- Kondisi masuk: Sinyal beli saat harga menembus 20 siklus EMA dari bawah dan ketiga garis rata berada dalam tren naik
- Kondisi Keluar: Pecat posisi saat RSI lebih dari 70 (Overbought) atau saat harga turun di bawah 20 EMA siklus
- Manajemen posisi: Menggunakan persentase dari total nilai akun (<10%) untuk memegang posisi
Keunggulan Strategis
- Multiple confirmation mechanism: saling verifikasi EMA dan RSI pada tiga periode berbeda untuk mengurangi risiko false breakout
- Pelacakan Tren: Dapat menangkap tren jangka menengah dan panjang secara efektif untuk meningkatkan profitabilitas
- Pengendalian risiko: Menggunakan sinyal overbought RSI dan penurunan garis rata-rata sebagai kondisi stop loss untuk mengontrol penarikan secara efektif
- Manajemen dana: Menggunakan manajemen posisi persentase, volume transaksi dapat disesuaikan secara otomatis sesuai dengan ukuran akun
- Operasi sistematis: aturan strategi yang jelas, mengurangi gangguan dari penilaian subjektif
Risiko Strategis
- Lagging: EMA sebagai indikator lagging dapat menyebabkan sedikit penundaan waktu masuk dan keluar
- Risiko pasar bergoyang: sinyal palsu yang mungkin sering terjadi di pasar bergoyang horizontal
- Risiko terjun bebas: Pasar terjun bebas dapat menyebabkan stop loss tidak berlaku
- Sensitivitas Parameter: Ada kemungkinan perubahan siklus EMA dan RSI dalam kondisi pasar yang berbeda
- Biaya Transaksi: Transaksi yang sering dapat menyebabkan biaya transaksi yang lebih tinggi
Arah optimasi strategi
- Identifikasi situasi pasar: Menambahkan mekanisme penilaian kondisi pasar, secara otomatis menurunkan posisi atau menghentikan perdagangan di pasar yang bergoyang
- Optimasi parameter dinamis: menyesuaikan siklus EMA dan RSI secara otomatis sesuai dengan fluktuasi pasar
- Optimasi Stop Loss: Menggunakan Tracking Stop Loss Mechanism untuk Melindungi Keuntungan
- Optimasi Masuk: Meningkatkan mekanisme konfirmasi volume, meningkatkan keandalan sinyal terobosan
- Optimalisasi manajemen posisi: proporsi kepemilikan posisi disesuaikan dengan kekuatan tren dan dinamika volatilitas pasar
Meringkaskan
Ini adalah sistem strategi kompleks yang menggabungkan pelacakan tren dan pembalikan momentum. Dengan penggunaan kombinasi dari beberapa indikator teknis, karakteristik risiko-penghasilan yang lebih baik dicapai sambil menjaga strategi tetap sederhana dan mudah dimengerti. Keunggulan inti dari strategi adalah mekanisme konfirmasi tren yang ketat dan sistem kontrol risiko yang baik, tetapi dalam aplikasi praktis perlu memperhatikan optimasi parameter dan adaptasi dengan lingkungan pasar. Dengan arah optimasi yang disarankan, strategi masih memiliki ruang untuk peningkatan lebih lanjut.
/*backtest
start: 2024-02-18 00:00:00
end: 2025-02-17 00:00:00
period: 4h
basePeriod: 4h
exchanges: [{"eid":"Futures_Binance","currency":"BTC_USDT"}]
*/

//@version=5
strategy("EMA Crossover + RSI Strategy", overlay=true, initial_capital=10000, default_qty_type=strategy.percent_of_equity, default_qty_value=200)

// Calculate EMAs- 1