Ringkasan
Strategi ini adalah sistem perdagangan pelacakan tren yang menggabungkan beberapa indikator teknis. Ini terutama didasarkan pada sinyal silang rata-rata bergerak sederhana (SMA) dan rata-rata bergerak indeks (EMA) dan mengintegrasikan beberapa fitur canggih seperti pita tren HMA, indikator William (%R), analisis titik tinggi dan rendah yang berayun, untuk memberikan sinyal perdagangan yang lebih andal melalui mekanisme penyaringan dinamis.
Prinsip Strategi
Logika inti dari strategi ini didasarkan pada beberapa elemen kunci:
- Menggunakan SMA periode 100 dan EMA periode 200 sebagai indikator utama untuk menilai tren
- Band tren HMA dengan integrasi 70 siklus digunakan untuk mengkonfirmasi dinamika tren
- Perhitungan bit dukungan / resistensi dinamis menggunakan indikator William ((%R)
- Deteksi jendela mundur 20-siklus untuk mendeteksi titik-titik tinggi dan rendah
- Pemantauan dan pembaruan secara real-time
- Siapkan filter awal buka dan nilai terendah fluktuasi ((0.5%) untuk mengurangi sinyal palsu
Syarat masuk harus dipenuhi pada saat yang sama: garis rata-rata ganda di stasiun harga, indikator% R naik 3 garis K berturut-turut dan lebih besar dari -20, garis K ditutup dan harga penutupan lebih tinggi dari yang sebelumnya, harga tidak melebihi batas fluktuasi harian. Kondisi keluar memenuhi salah satu dari kondisi berikut: harga jatuh di bawah garis rata-rata ganda, indikator% R lebih rendah dari -80
Keunggulan Strategis
- Verifikasi sinkronisasi dari beberapa indikator teknis meningkatkan keandalan sinyal perdagangan
- Mekanisme pemfilteran dinamis efektif mengurangi sinyal palsu pada periode lonjakan fluktuasi
- Perhitungan resistensi dukungan yang beradaptasi membuat strategi memiliki kemampuan beradaptasi dengan pasar yang baik
- Mekanisme manajemen perdagangan intraday yang lengkap, termasuk penyaringan awal buka dan kontrol nilai ambang volatilitas
- Parameter yang dapat disesuaikan dengan mudah untuk dioptimalkan sesuai dengan kondisi pasar yang berbeda
Risiko Strategis
- Sistem linier dapat menghasilkan sinyal palsu yang sering terjadi di pasar yang bergoyang
- Penyaringan dengan beberapa kondisi dapat menyebabkan kehilangan beberapa peluang perdagangan potensial.
- Periode rata-rata bergerak tetap mungkin berbeda dalam berbagai kondisi pasar
- Mekanisme penyaringan perdagangan dalam hari dapat kehilangan peluang penting dalam tren yang cepat
- Optimasi parameter yang berlebihan dapat menyebabkan masalah over-fitting
Arah optimasi strategi
- Memperkenalkan mekanisme perhitungan periodik rata-rata yang beradaptasi, sehingga sistem dapat beradaptasi dengan lebih baik terhadap fluktuasi pasar
- Meningkatkan indikator analisis volume transaksi untuk meningkatkan keandalan identifikasi tren
- Mengembangkan mekanisme stop loss yang dinamis dan meningkatkan efisiensi pengelolaan dana
- Menambahkan indikator volatilitas pasar untuk mengoptimalkan kondisi penyaringan
- Mempertimbangkan sinkronisasi sinyal pada periode waktu yang berbeda, meningkatkan stabilitas sistem
Meringkaskan
Ini adalah sistem perdagangan pelacakan tren yang dirancang dengan baik, dengan kombinasi beberapa indikator teknis dan mekanisme penyaringan yang ketat, tetap memiliki fleksibilitas yang baik sambil menjamin keandalan. Ruang untuk pengoptimalan strategi terutama terletak pada kemampuan beradaptasi parameter dan perbaikan mekanisme manajemen risiko.
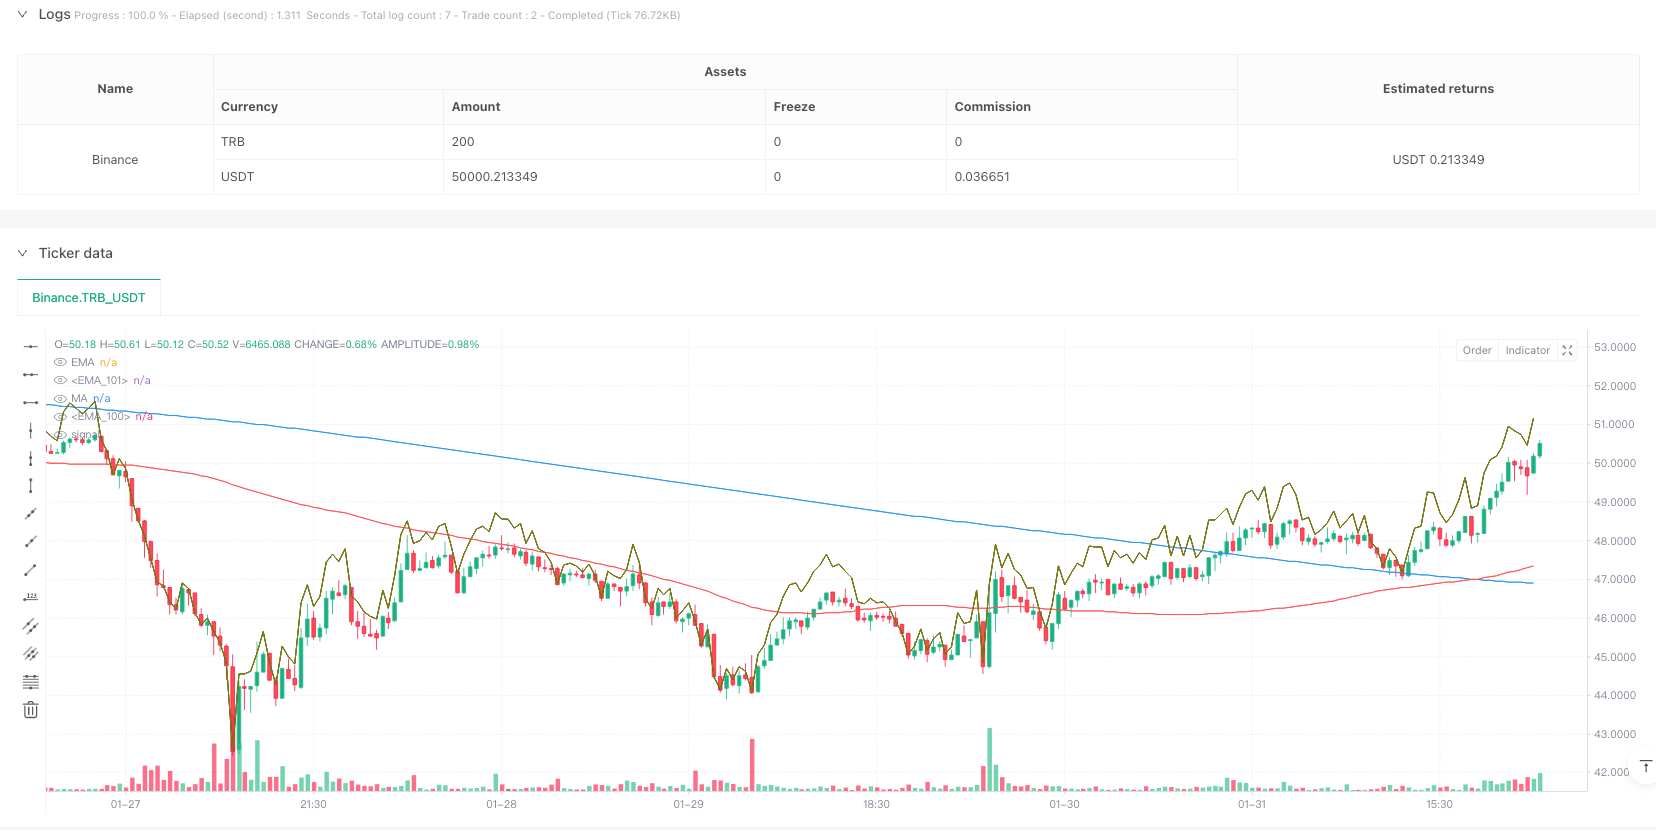
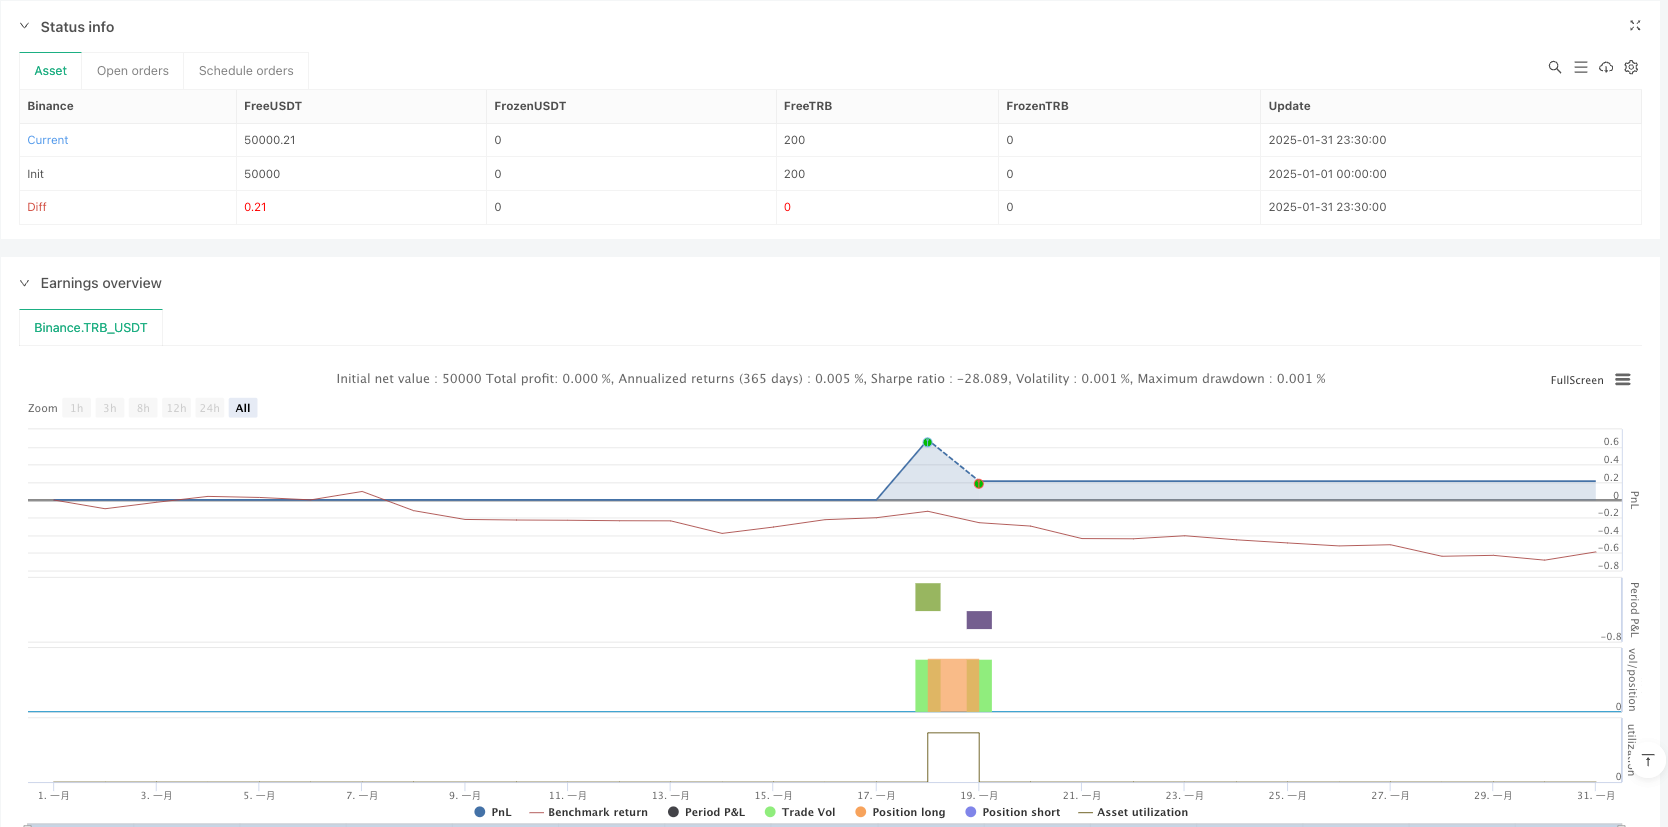
/*backtest
start: 2025-01-01 00:00:00
end: 2025-01-31 23:59:59
period: 30m
basePeriod: 30m
exchanges: [{"eid":"Binance","currency":"TRB_USDT"}]
*/

//@version=5
strategy(title="EMA & MA Crossover Strategy", shorttitle="EMA & MA Crossover Strategy", overlay=true)

// Inputs
LengthMA = input.int(100, minval=1, title="MA Length")
LengthEMA = input.int(200, minval=1, title="EMA Length")
swingLookback = input.int(20, title="Swing Lookback")
Lengthhmaribbon = input.int(70, minval=1, title="HMA Ribbon")
// Input for ignoring the first `n` candles of the day
ignore_n_candles = input.int(1, "Ignore First N Candles", minval=0)
// Input for percentage threshold to ignore high run-up candles
run_up_threshold = input.float(0.5, "Run-up Threshold (%)", minval=0.0)

//====================================================================
hmacondition = ta.hma(close,Lengthhmaribbon)> ta.hma(close,Lengthhmaribbon)[1]

//====================================================================
// Function to drop the first `n` candles
dropn(src, n) =>
    na(src[n]) ? na : src

// Request data with the first `n` candles dropped
valid_candle = not na(dropn(close, ignore_n_candles))
// Check for run-up condition on the previous candle
prev_run_up = (high[1] - low[1]) / low[1] * 100

// Combine conditions: exclude invalid candles and ignore high run-up candles
valid_entry_condition = valid_candle and prev_run_up <= run_up_threshold

//======================================================
// Define the start of a new day based on time
var is_first = false
var float day_high = na
var float day_low = na

// Use time() to detect the start of a new day
t = time("1440") // 1440 = 60 * 24 (one full day in minutes)
is_first := na(t[1]) and not na(t) or t[1] < t

if is_first and barstate.isnew
    day_high := high
    day_low := low
else
    day_high := nz(day_high[1], high)
    day_low := nz(day_low[1], low)

// Update daily high and low
if high > day_high
    day_high := high

if low < day_low
    day_low := low

//====================================================
previousdayclose = request.security(syminfo.tickerid, "D", close)

day_highrange = previousdayclose*.018
//======================================================
length = input(title="Length", defval=14)
src = input(close, "Source")
_pr(length) =>
	max = ta.highest(length)
	min = ta.lowest(length)
	100 * (src - max) / (max - min)
percentR = _pr(length)

//======================================================
higherline = close* 1+((100-(percentR*-1))/100)
lowerline = close* 1-((100-(percentR*-1))/100)
//======================================================
// Moving Averages
xMA = ta.sma(close, LengthMA)
xEMA = ta.sma(xMA, LengthEMA)

// Plot the MA and EMA lines
plot(xMA, color=color.red, title="MA")
plot(xEMA, color=color.blue, title="EMA")

// Find recent swing high and low
recentHigh = ta.highest(high, swingLookback)
recentLow = ta.lowest(low, swingLookback)
//===============================================
emacondition = ta.ema(close,20)>ta.ema(close,30) and ta.ema(close,30)>ta.ema(close,40) and ta.ema(close,40)>ta.ema(close,50) and close >ta.ema(close,20)
// Define Buy Condition
buyCondition1 = (percentR>percentR[1] and percentR[1]>percentR[2] and percentR[2]>percentR[3]) and percentR>-20 and percentR[1]>-20
buyCondition = (close> xMA and close> xEMA) and (close > open and close > close[1]) or xMA>xEMA and close<day_highrange and hmacondition and emacondition

// Define Sell Conditions
sellCondition = (close < xMA and close < xEMA) or xMA<xEMA or percentR<-80

// Strategy Execution
if (buyCondition and buyCondition1 and valid_entry_condition)
    strategy.entry("Buy", strategy.long)

if (sellCondition)
    strategy.close("Buy")  // Close the long position

// Candle coloring for buy/sell indication
barcolor(buyCondition ? color.green : sellCondition ? color.red : na)
plot(higherline, color=color.olive, title="EMA")
plot(higherline, color=color.black, title="EMA")