Ringkasan
Strategi ini adalah sistem perdagangan komprehensif yang didasarkan pada analisis teknis, yang menggabungkan area resistensi dukungan, bentuk grafik, dan analisis struktur pasar. Strategi ini membuat keputusan perdagangan dengan mengidentifikasi tingkat harga kunci, mengkonfirmasi sinyal grafik, dan mengevaluasi tren pasar secara keseluruhan.
Prinsip Strategi
Logika inti dari strategi ini didasarkan pada beberapa komponen utama:
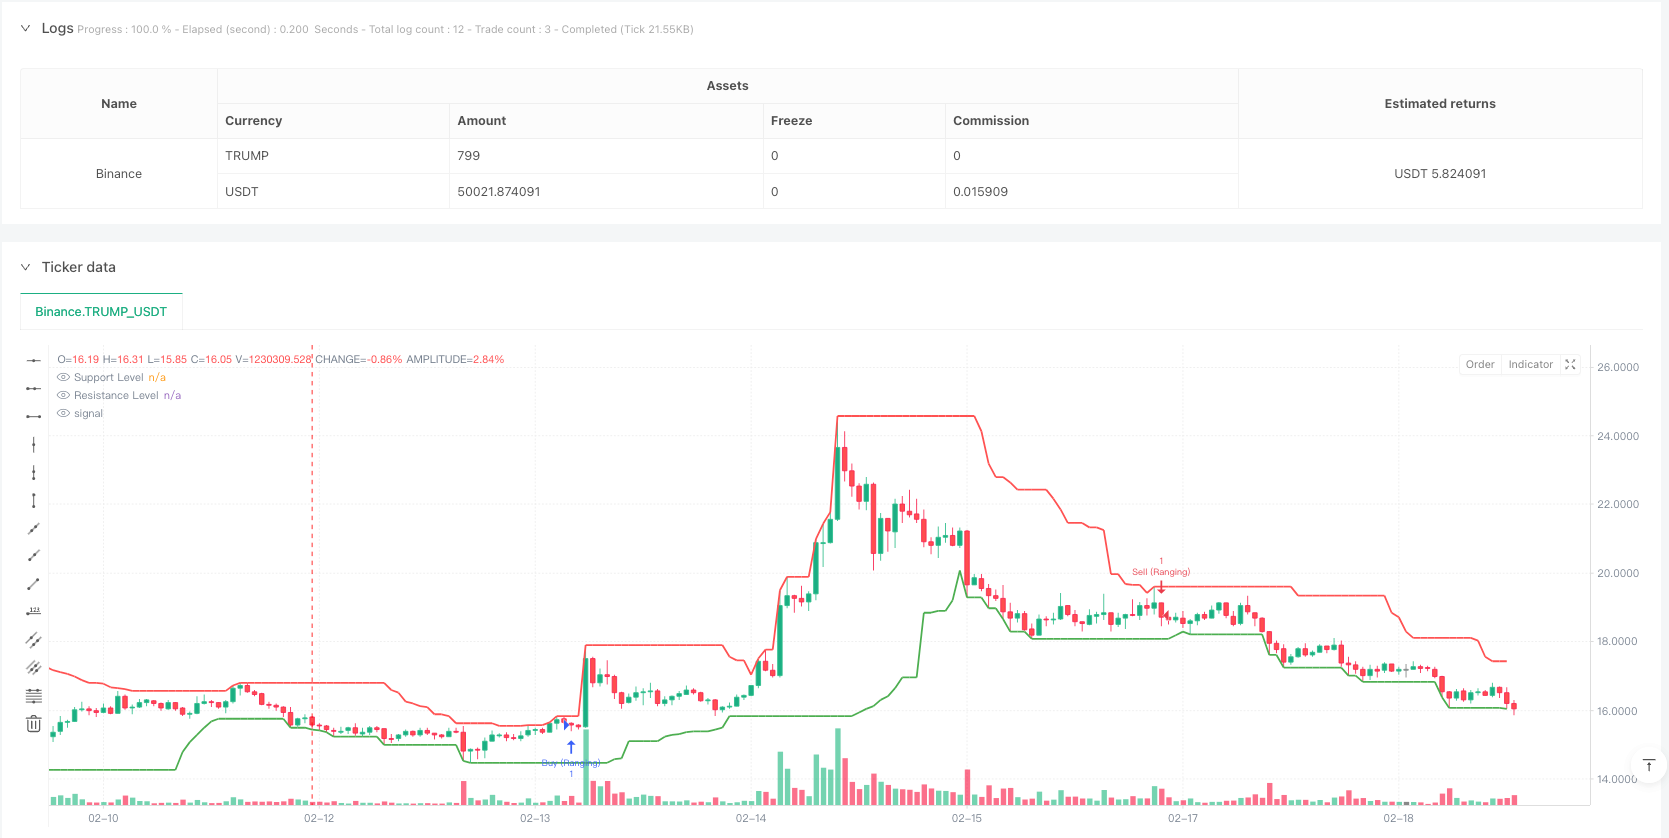
- Identifikasi area resistensi dukungan - menggunakan harga tertinggi dan terendah dari 20 siklus terakhir untuk menentukan tingkat harga kritis
- Pengesahan bentuk grafik - termasuk bentuk-bentuk yang khas seperti penyelundupan bullish, penyelundupan bearish, garis konko dan garis meteorit
- Analisis struktur pasar - menilai apakah pasar berada dalam tren naik, tren turun, atau bergejolak dengan membandingkan urutan titik tinggi dan titik rendah
- Manajemen risiko - mengatur posisi stop loss dengan stop loss tetap dan rasio risiko / keuntungan 1: 3
Strategi ini bekerja di tiga lingkungan pasar: pasar tren, pasar interval, dan pasar pivot, tetapi dengan kombinasi aturan perdagangan yang berbeda untuk setiap lingkungan.
Keunggulan Strategis
- Analisis multi-dimensi - memberikan sinyal perdagangan yang lebih andal dengan mengintegrasikan tingkat harga, pola grafik, dan struktur pasar
- Adaptif - mampu beradaptasi dengan kondisi pasar yang berbeda, termasuk tren dan interval
- Manajemen risiko yang baik - Mengadopsi rasio risiko-nilai yang tetap, memastikan bahwa setiap transaksi memiliki kontrol risiko yang jelas
- Dukungan visual - Dukungan area resistensi dengan tag grafis untuk membantu trader memahami kondisi pasar
Risiko Strategis
- Risiko False Breakout - Harga dapat mundur dengan cepat setelah melakukan breakout, menghasilkan sinyal palsu
- Risiko slippage - harga transaksi yang sebenarnya mungkin jauh berbeda dari perkiraan selama periode fluktuasi yang kuat
- Sensitivitas parameter - pilihan parameter seperti siklus resistensi, siklus struktur pasar, dan lain-lain dapat secara signifikan mempengaruhi kinerja strategi
- Ketergantungan pada kondisi pasar - dapat berkinerja buruk dalam pergerakan cepat satu arah atau pasar yang sangat bergejolak
Arah optimasi strategi
- Dynamic parameter adjustment - siklus yang dihitung untuk secara otomatis menyesuaikan area resistensi dukungan berdasarkan fluktuasi pasar
- Peningkatan filter - penambahan indikator seperti volume lalu lintas, volatilitas untuk memfilter sinyal penembusan palsu
- Stop Loss Optimization - Mengimplementasikan pengaturan stop loss dinamis berbasis ATR untuk meningkatkan adaptasi terhadap fluktuasi pasar
- Validasi kerangka waktu - memperkenalkan analisis kerangka waktu ganda untuk meningkatkan keandalan sinyal
- Optimalisasi manajemen posisi - penyesuaian ukuran posisi secara dinamis berdasarkan volatilitas pasar dan intensitas sinyal
Meringkaskan
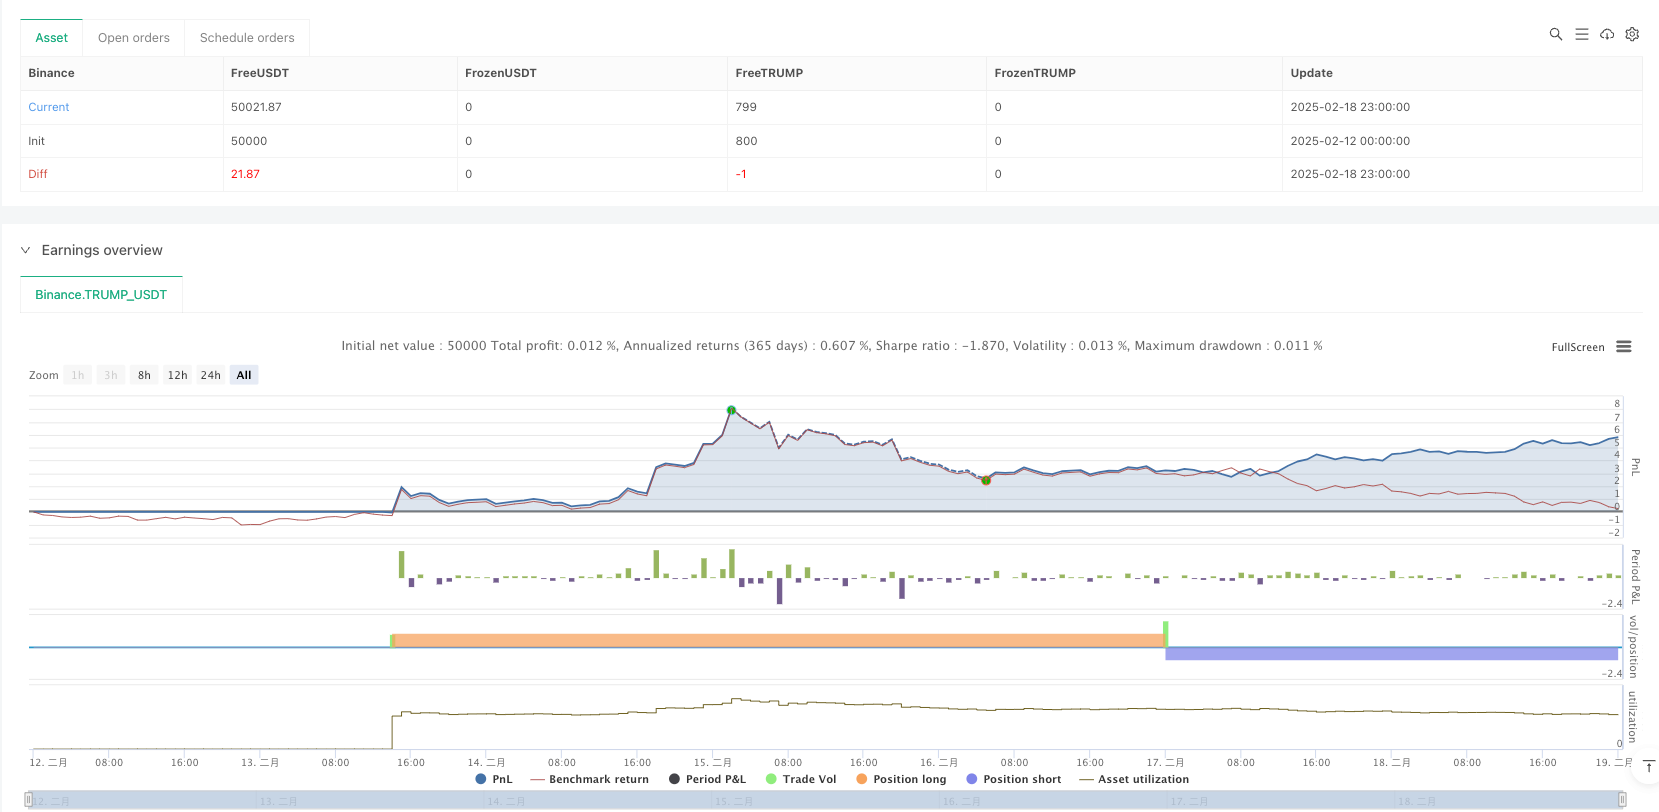
Strategi ini membangun sistem perdagangan yang lengkap dengan menggunakan beberapa alat analisis teknis secara komprehensif. Keuntungannya adalah analisis multi-dimensi dan manajemen risiko yang baik, tetapi juga menghadapi tantangan seperti terobosan palsu dan sensitivitas parameter. Dengan arah optimasi yang disarankan, strategi ini diharapkan untuk meningkatkan stabilitas dan fleksibilitas lebih lanjut dengan mempertahankan keuntungan yang ada. Untuk berhasil menerapkan strategi ini, pedagang perlu memahami setiap komponen dan melakukan penyesuaian parameter yang sesuai sesuai dengan situasi pasar yang sebenarnya.
/*backtest
start: 2025-02-12 00:00:00
end: 2025-02-19 00:00:00
period: 1h
basePeriod: 1h
exchanges: [{"eid":"Binance","currency":"TRUMP_USDT"}]
*/

//@version=5
strategy("Support/Resistance Strategy with Candlestick Confirmation, Market Structure, and 1:3 R:R", overlay=true)

// Input parameters
supportResistancePeriod = input.int(20, title="Support/Resistance Period", minval=1)
stopLossPips = input.int(50, title="Stop Loss (in pips)", minval=1)
takeProfitRatio = input.float(3.0, title="Risk-to-Reward Ratio", minval=1.0)
structurePeriod = input.int(20, title="Market Structure Period", minval=1)  // Period to determine market structure

// Function to calculate support level (lowest low in the period)
getSupportLevel() =>
    ta.lowest(low, supportResistancePeriod)

// Function to calculate resistance level (highest high in the period)
getResistanceLevel() =>
    ta.highest(high, supportResistancePeriod)

// Get the support and resistance levels
supportLevel = getSupportLevel()
resistanceLevel = getResistanceLevel()

// Function to detect market structure
isBullishTrend() =>
    high[structurePeriod] > high[structurePeriod+1] and low[structurePeriod] > low[structurePeriod+1]

isBearishTrend() =>
    high[structurePeriod] < high[structurePeriod+1] and low[structurePeriod] < low[structurePeriod+1]

isRanging() =>
    not isBullishTrend() and not isBearishTrend()

// Candlestick Pattern Detection Functions
isBullishEngulfing() =>
    close[1] < open[1] and close > open and close > open[1] and open < close[1]

isBearishEngulfing() =>
    close[1] > open[1] and close < open and close < open[1] and open > close[1]

isDoji() =>
    math.abs(close - open) <= (high - low) * 0.1

isHammer() =>
    body = math.abs(close - open)
    upperShadow = high - math.max(close, open)
    lowerShadow = math.min(close, open) - low
    body <= (high - low) * 0.3 and lowerShadow > body * 2 and upperShadow <= body * 0.5

isShootingStar() =>
    body = math.abs(close - open)
    upperShadow = high - math.max(close, open)
    lowerShadow = math.min(close, open) - low
    body <= (high - low) * 0.3 and upperShadow > body * 2 and lowerShadow <= body * 0.5

// Conditions for Buy and Sell based on candle close
buyCondition = (isBullishEngulfing() or isHammer()) and close > supportLevel
sellCondition = (isBearishEngulfing() or isShootingStar()) and close < resistanceLevel

// Define buy/sell conditions based on market structure
bullishMarket = isBullishTrend() and buyCondition
bearishMarket = isBearishTrend() and sellCondition
rangingMarket = isRanging() and (buyCondition or sellCondition)

// Calculate the Stop Loss and Take Profit Levels
longStopLoss = supportLevel - (stopLossPips * syminfo.mintick)
shortStopLoss = resistanceLevel + (stopLossPips * syminfo.mintick)

// Calculate R:R based Take Profit Levels
longTakeProfit = close + (math.abs(close - longStopLoss) * takeProfitRatio)
shortTakeProfit = close - (math.abs(close - shortStopLoss) * takeProfitRatio)

// Plotting Support and Resistance Lines
plot(supportLevel, color=color.green, linewidth=2, title="Support Level", style=plot.style_line)
plot(resistanceLevel, color=color.red, linewidth=2, title="Resistance Level", style=plot.style_line)

// Strategy: Buy on Support, Sell on Resistance with candlestick confirmation and market structure
if (bullishMarket)
    strategy.entry("Buy", strategy.long, stop=longStopLoss, limit=longTakeProfit)

if (bearishMarket)
    strategy.entry("Sell", strategy.short, stop=shortStopLoss, limit=shortTakeProfit)

if (rangingMarket)
    if (buyCondition)
        strategy.entry("Buy (Ranging)", strategy.long, stop=longStopLoss, limit=longTakeProfit)
    if (sellCondition)
        strategy.entry("Sell (Ranging)", strategy.short, stop=shortStopLoss, limit=shortTakeProfit)

// Optional: Highlighting the zones for support and resistance
bgcolor(close > resistanceLevel ? color.new(color.red, 90) : na, title="Resistance Zone")
bgcolor(close < supportLevel ? color.new(color.green, 90) : na, title="Support Zone")