Pelacakan tren multi-periode dan strategi konfirmasi volume

2
Follow
478
Followers
Ringkasan
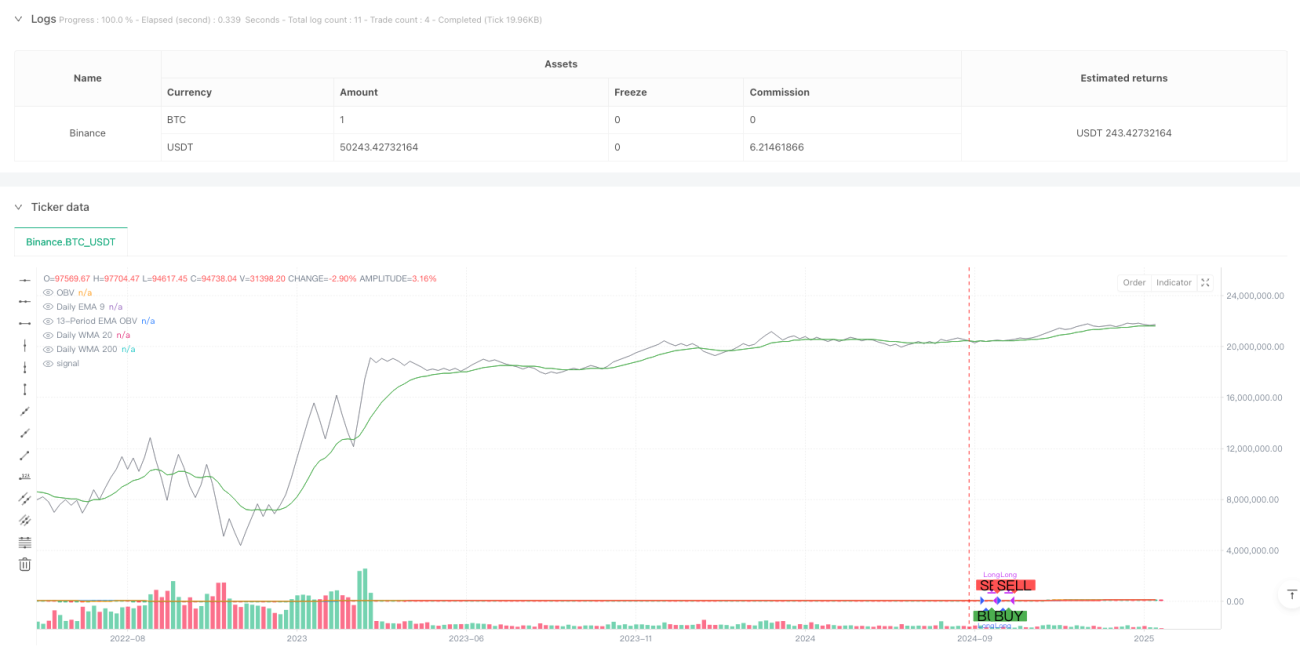
Strategi ini adalah sistem pelacakan tren yang menggabungkan moving average multi-periode dan analisis volume transaksi. Strategi ini mengkonfirmasi tren keseluruhan melalui tiga garis rata-rata EMA9, WMA20 dan WMA200 pada siklus garis matahari, sambil memperkenalkan indikator OBV (On Balance Volume) dan EMA untuk mengkonfirmasi volume perdagangan, untuk mencapai perdagangan pelacakan tren yang lebih kuat.
Prinsip Strategi
Strategi ini didasarkan pada dua kondisi utama:
- Konfirmasi tren - untuk mengkonfirmasi arah tren dengan menilai apakah tiga garis harian (EMA9, WMA20, WMA200) berada di posisi naik. Ketika tiga garis rata-rata miring ke atas, menunjukkan bahwa setiap periode waktu menunjukkan tren multihead.
- Konfirmasi volume transaksi - Analisis volume transaksi dengan indikator OBV dan 13 siklus EMA. Ketika EMA OBV berada di atas OBV, menunjukkan bahwa volume transaksi mendukung kenaikan harga, mengkonfirmasi efektivitas tren.
Strategi hanya akan menghasilkan sinyal ganda jika kedua kondisi tersebut terpenuhi secara bersamaan. Strategi akan keluar dengan tenang jika salah satu kondisi tidak terpenuhi.
Keunggulan Strategis
- Analisis Multiple Time Frame - Mengurangi risiko false breakout dengan mempertimbangkan tren jangka pendek (EMA9), jangka menengah (WMA20) dan jangka panjang (WMA200) secara komprehensif.
- Dukungan volume transaksi - Pendahuluan analisis indikator OBV untuk memastikan bahwa pergerakan harga didukung oleh volume transaksi.
- Pengendalian risiko yang baik - Menggunakan manajemen posisi persentase dan pertimbangan biaya, lebih sesuai dengan lingkungan perdagangan yang sebenarnya.
- Dukungan visual - Membantu trader memahami kapan masuk dan keluar dengan tanda grafis yang jelas.
Risiko Strategis
- Penundaan pembalikan tren - mungkin reaksi lambat pada awal pembalikan tren karena penggunaan konfirmasi garis rata-rata ganda.
- Tidak berlaku untuk pasar bergoyang-goyang - sering terjadi false breakout yang dapat menyebabkan terlalu banyak transaksi pada tahap pengelompokan horizontal.
- Pertimbangan biaya modal - biaya 0.1% dapat secara signifikan mempengaruhi keuntungan dalam perdagangan frekuensi tinggi.
Arah optimasi strategi
- Memperkenalkan indikator volatilitas - Anda dapat mempertimbangkan untuk menambahkan indikator volatilitas seperti ATR, untuk menyesuaikan posisi secara dinamis dalam lingkungan pasar yang berbeda.
- Perbaikan mekanisme Stop Loss - disarankan untuk menambahkan fitur Stop Loss Tracking untuk lebih melindungi keuntungan.
- Market Environment Filter - Menambahkan indikator penilaian kondisi pasar untuk mengurangi frekuensi atau menghentikan perdagangan di pasar yang bergejolak.
- Pilihan parameter optimasi - pertimbangkan untuk mengoptimalkan siklus rata-rata dan parameter OBV untuk berbagai pasar dan varietas.
Meringkaskan
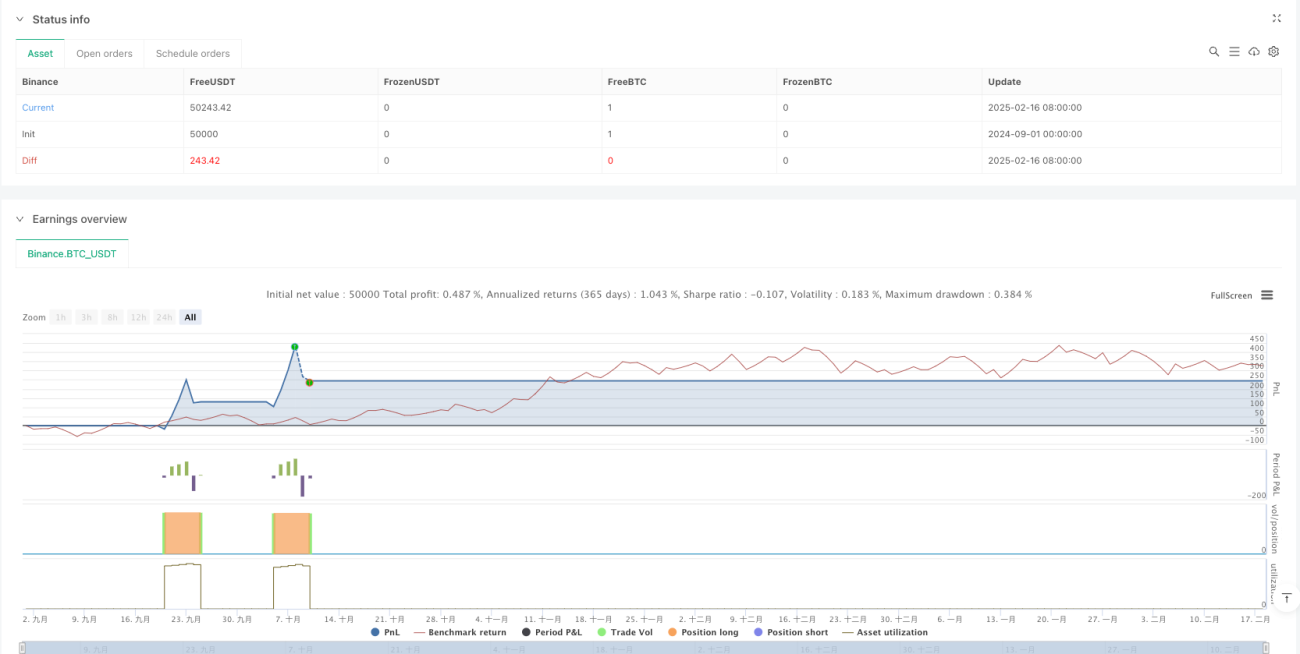
Strategi ini dengan menggabungkan analisis tren multi-siklus dan konfirmasi volume transaksi, membangun sistem pelacakan tren yang relatif lengkap. Logika strategi jelas, kontrol risiko masuk akal, tetapi masih ada ruang untuk optimasi.
Source
Pine
/*backtest
start: 2024-09-01 00:00:00
end: 2025-02-18 08:00:00
period: 5d
basePeriod: 5d
exchanges: [{"eid":"Binance","currency":"BTC_USDT"}]
*/

//@version=6
strategy("Strategy: Daily MAs + OBV", overlay=true, initial_capital=10000, default_qty_type=strategy.percent_of_equity, default_qty_value=10, commission_type=strategy.commission.percent, commission_value=0.1)

//=== Daily Moving Averages Calculation =========================Related strategies
Comment
All comments (0)
No data
- 1