Strategi crossover multi-indikator adaptif dinamis dikombinasikan dengan sistem pengendalian risiko cerdas SRSI dan MACD

Ringkasan
Strategi ini adalah sistem perdagangan dinamis yang menggabungkan indikator yang relatif kuat secara acak (SRSI) dan indikator tren rata-rata bergerak / dispersi (MACD). Strategi ini secara dinamis menyesuaikan stop loss dan stop loss dengan indikator ATR, yang memungkinkan manajemen cerdas risiko. Inti dari strategi ini adalah menghasilkan sinyal perdagangan melalui konfirmasi silang dari beberapa indikator teknis, sambil mengelola posisi dengan volatilitas pasar.
Prinsip Strategi
Strategi ini didasarkan pada beberapa mekanisme utama:
- Penjelasan tentang tren pasar dengan menghitung perbedaan antara garis K dan garis D dalam indikator SRSI, dan perbedaan antara garis K dan MACD yang dirumuskan
- Kondisi pembelian harus dipenuhi secara bersamaan: K-D adalah positif, K-MACD adalah positif, dan MACD tidak berada dalam tren menurun
- Kondisi jual harus dipenuhi pada saat yang sama: K-D adalah negatif, K-MACD adalah negatif, dan MACD tidak dalam tren naik
- Menggunakan ATR kali faktor risiko untuk secara dinamis menghitung stop loss dan stop loss, menyesuaikan diri dengan volatilitas pasar
Keunggulan Strategis
- Mekanisme konfirmasi multi-sinyal secara signifikan meningkatkan keandalan transaksi, menghindari sinyal palsu yang mungkin dibawa oleh satu indikator
- Pengaturan stop loss yang dinamis dapat secara otomatis disesuaikan dengan fluktuasi pasar, memberikan rasio risiko / keuntungan yang lebih baik
- Strategi memiliki kemampuan beradaptasi yang baik dan dapat mempertahankan kinerja yang stabil di berbagai lingkungan pasar
- Parameter yang dapat disesuaikan, memungkinkan trader untuk mengoptimalkan sesuai dengan preferensi risiko pribadi
Risiko Strategis
- Terlalu banyak sinyal perdagangan dapat dihasilkan di pasar yang bergoyang, yang menyebabkan sering masuk dan keluar dari pasar
- Penggunaan beberapa indikator dapat menyebabkan sinyal terlambat, kehilangan waktu terbaik untuk masuk dalam pasar yang berubah dengan cepat
- ATR didasarkan pada volatilitas historis dan mungkin tidak dapat disesuaikan dengan perubahan volatilitas pasar
- Faktor risiko yang perlu diatur secara rasional, terlalu besar atau terlalu kecil dapat mempengaruhi efektivitas strategi
Arah optimasi strategi
- Menambahkan filter tren, menggunakan standar pengakuan sinyal yang berbeda di pasar bergolak dan pasar tren
- Pengenalan indikator volume lalu lintas sebagai konfirmasi tambahan untuk meningkatkan keandalan sinyal
- Metode perhitungan untuk mengoptimalkan stop loss yang dapat dipertimbangkan dengan kombinasi resistance level support
- Bergabung dengan model untuk memprediksi volatilitas pasar dan menyesuaikan parameter risiko lebih awal
- Pertimbangkan untuk melakukan konfirmasi sinyal pada periode waktu yang berbeda untuk meningkatkan kehandalan strategi
Meringkaskan
Strategi ini membangun sistem perdagangan yang solid dengan menggabungkan keunggulan SRSI dan MACD. Mekanisme manajemen risiko yang dinamis membuatnya memiliki kemampuan adaptasi yang baik, tetapi masih membutuhkan parameter yang dioptimalkan oleh pedagang sesuai dengan situasi pasar yang sebenarnya.
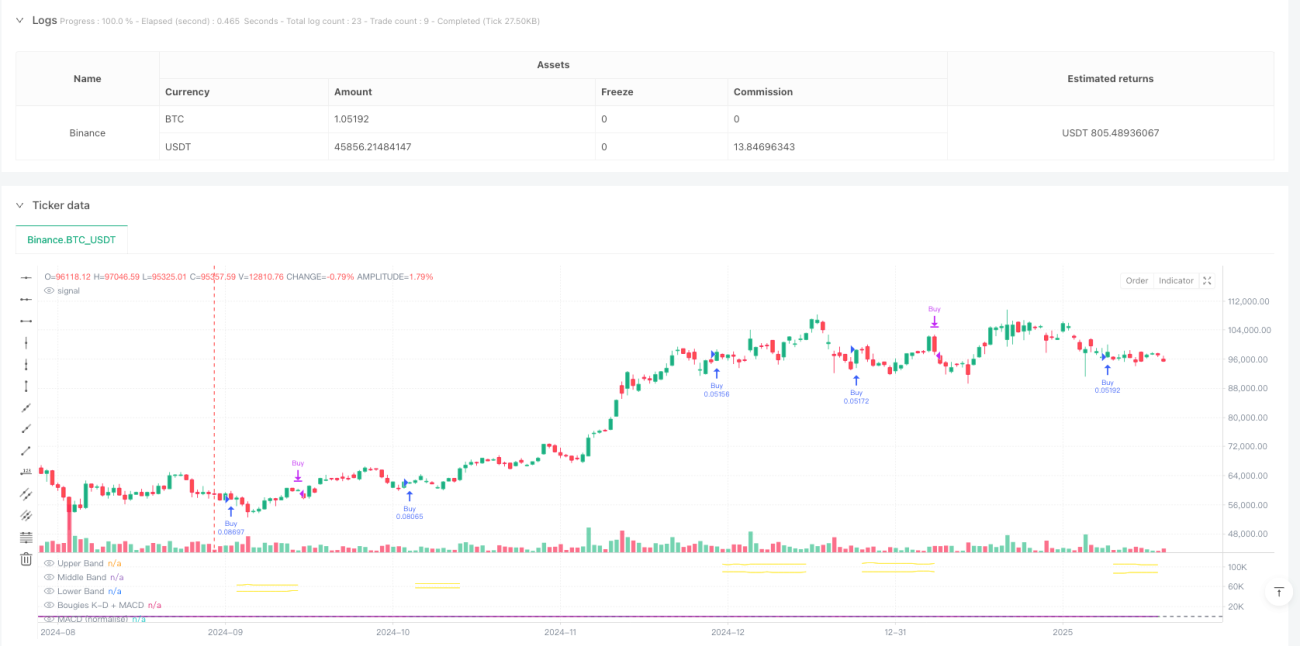
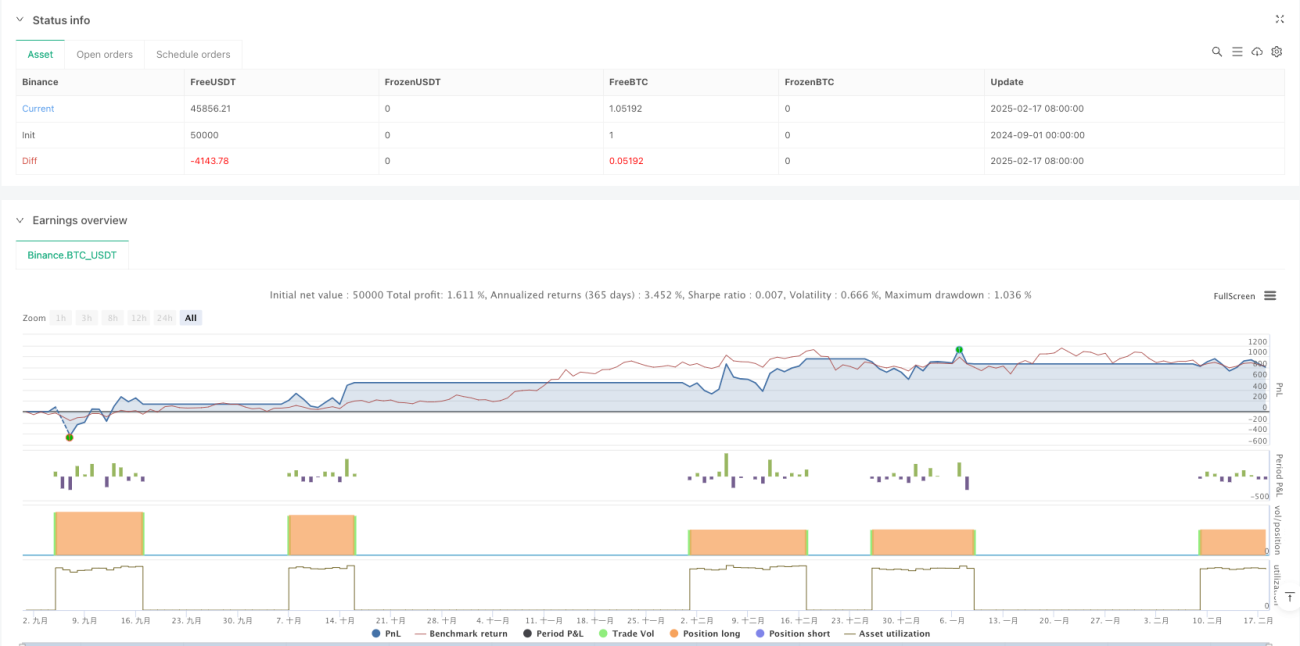
/*backtest
start: 2024-09-01 00:00:00
end: 2025-02-18 08:00:00
period: 1d
basePeriod: 1d
exchanges: [{"eid":"Binance","currency":"BTC_USDT"}]
*/

//@version=6
strategy(title="SRSI + MACD Strategy with Dynamic Stop-Loss and Take-Profit", shorttitle="SRSI + MACD Strategy", overlay=false, default_qty_type=strategy.percent_of_equity, default_qty_value=10)

// User Inputs- 1