Strategi Adaptif Crossover EMA Dinamis Swing High Low

2
Follow
478
Followers
Ringkasan
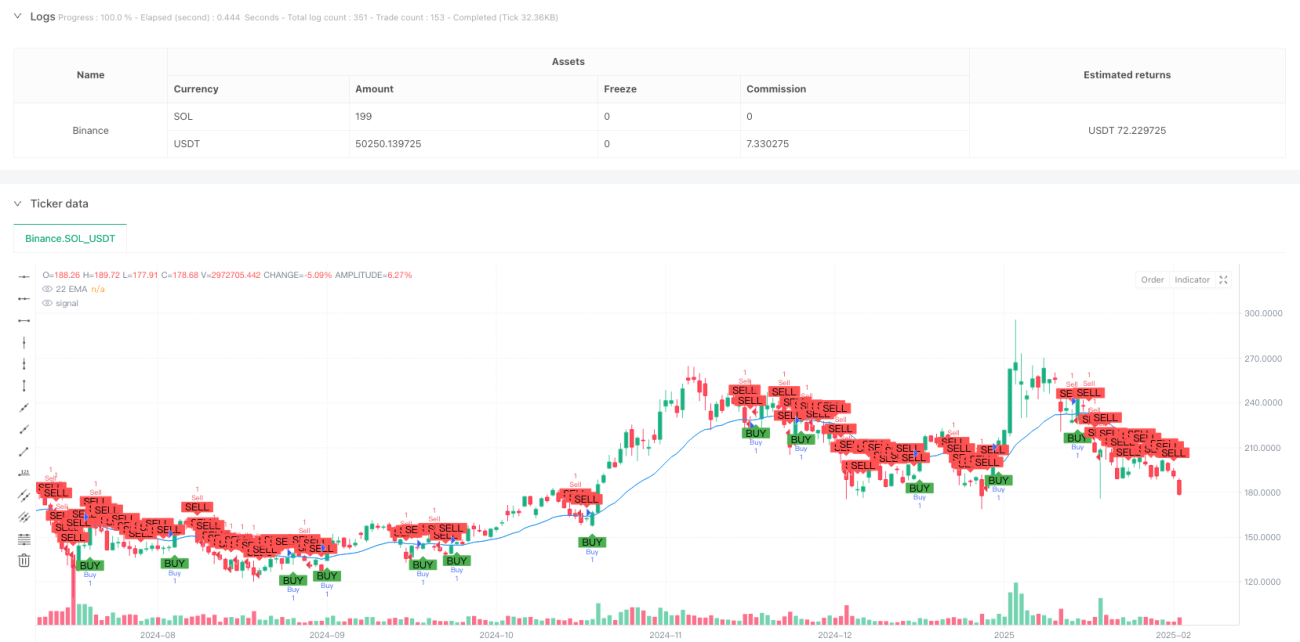
Strategi ini adalah sistem perdagangan yang didasarkan pada 22 periode indeks moving averages (EMA) sinyal silang dan titik bergoyang. Ini menghasilkan sinyal perdagangan melalui persilangan harga dengan EMA, dan menggunakan titik tinggi dan rendah yang bergoyang untuk mengatur posisi stop loss.
Prinsip Strategi
Logika inti dari strategi ini mencakup elemen-elemen kunci berikut:
- Menggunakan 22 siklus EMA sebagai indikator tren utama, siklus ini lebih baik untuk menyaring kebisingan pasar
- Ketika harga close out melewati EMA, maka akan terjadi sinyal bullish, dan ketika harga close out melewati EMA, maka akan terjadi sinyal bullish.
- Berhitung titik tinggi dan rendah dengan data historis selama 14 siklus
- Berdagang lebih banyak dengan tujuan stop di titik tinggi yang baru saja bergerak, dan stop di titik rendah yang baru saja bergerak
- Perdagangan short term dengan stop loss sebagai target dan stop loss sebagai titik tinggi
Keunggulan Strategis
- Adaptif terhadap tren: EMA 22 siklus dapat secara efektif menangkap tren jangka menengah, menghindari terlalu sering perdagangan
- Manajemen risiko yang dinamis: Stop Loss Point akan beradaptasi secara otomatis dengan pergerakan pasar, meningkatkan fleksibilitas strategi
- Eksekusi yang jelas: sinyal perdagangan yang jelas, tidak ada area yang tidak jelas untuk penilaian
- Rasio risiko-keuntungan yang wajar: dengan mengayunkan stop-loss pada setelan titik, menjamin rasio risiko-keuntungan untuk setiap perdagangan relatif stabil
- Efek visualisasi yang baik: Strategi memberikan sinyal visual yang jelas untuk memudahkan trader memahami dan memantau
Risiko Strategis
- Risiko pasar bergoyang: kemungkinan munculnya sinyal bolak-balik yang sering terjadi di pasar bergoyang
- Risiko slippage: Pada periode fluktuasi yang kuat, harga transaksi aktual mungkin memiliki deviasi yang lebih besar dari harga sinyal
- Risiko terjun bebas: terjun bebas dapat menyebabkan kegagalan stop loss, menyebabkan kerugian melebihi ekspektasi
- Risiko perubahan tren: kemungkinan kerugian berturut-turut di dekat titik perubahan tren utama
Arah optimasi strategi
- Pengenalan indikator volume transaksi: dapat mengkonfirmasi keandalan sinyal melalui volume transaksi
- Menambahkan filter tren: moving average dengan periode yang lebih panjang, memfilter sinyal countertrend
- Metode pengoptimalan stop loss: Anda dapat mempertimbangkan untuk menggunakan ATR untuk menyesuaikan jarak stop loss secara dinamis
- Filter waktu penambahan: larangan membuka posisi pada periode waktu tertentu untuk menghindari periode yang lebih bergejolak
- Mengembangkan mekanisme pengesahan sinyal: menggabungkan indikator teknis lainnya sebagai pengesahan sinyal, meningkatkan tingkat kemenangan
Meringkaskan
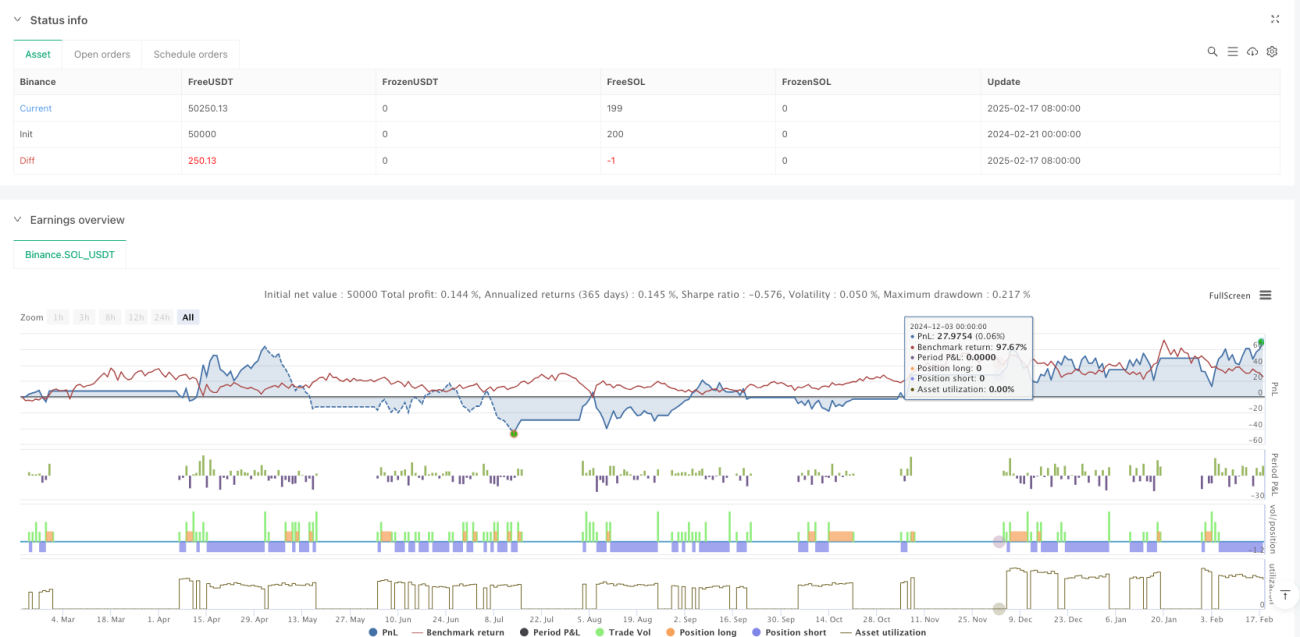
Ini adalah strategi pelacakan tren yang terstruktur dan logis. Strategi ini menghasilkan sinyal perdagangan melalui EMA silang, memanfaatkan risiko manajemen titik berayun, dan membentuk sistem perdagangan yang seimbang. Keuntungan utama dari strategi ini adalah kemampuannya untuk beradaptasi dengan pasar yang dinamis, dan risiko utamanya berasal dari perubahan kondisi pasar.
Source
Pine
Strategy parameters
Comment
All comments (0)
No data
- 1