
Ringkasan
Strategi ini adalah sistem perdagangan kuantitatif yang menggabungkan beberapa indikator teknis, tiga indikator teknis klasik yang bekerja sama dengan moving average (MA), indikator relatif kuat (RSI) dan dispersi tren rata-rata bergerak (MACD), untuk membangun sistem sinyal perdagangan yang lengkap. Strategi ini menggunakan cara pelacakan tren yang dikombinasikan dengan pengenalan dinamika, dengan memastikan arah perdagangan yang benar, tetapi juga fokus pada peluang.
Prinsip Strategi
Strategi ini didasarkan pada tiga tingkatan sinyal perdagangan:
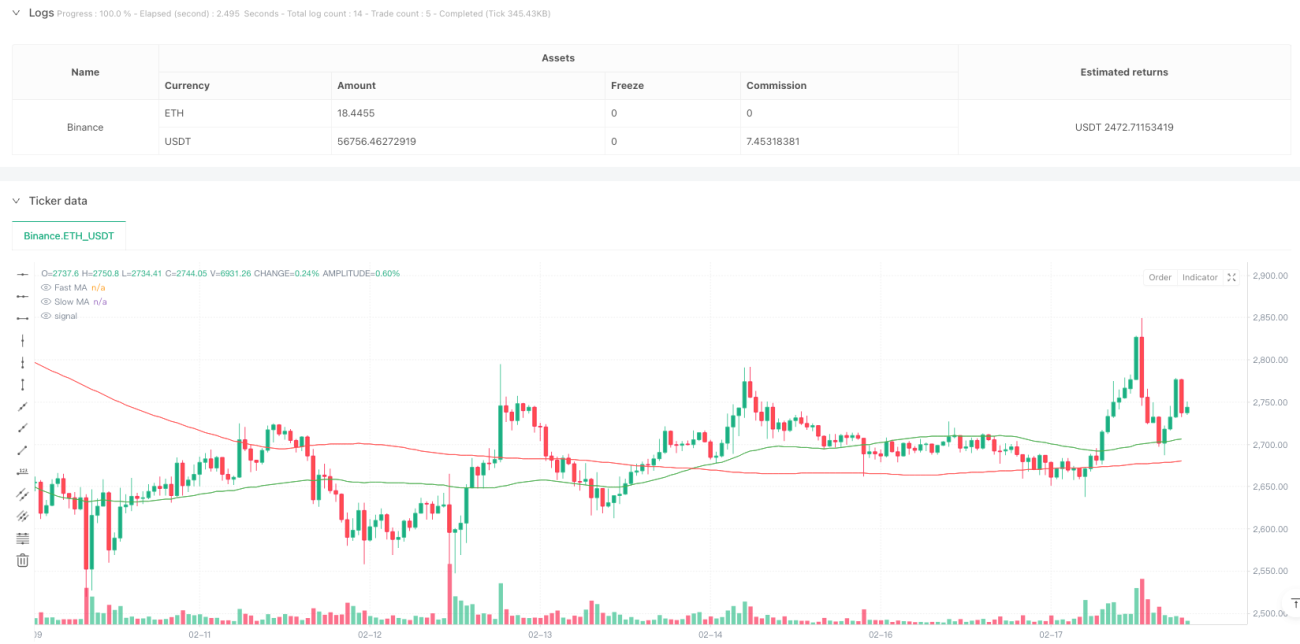
- Pengertian tren: menggunakan 50 hari dan 200 hari sistem dua garis rata-rata untuk menentukan arah tren besar melalui garpu emas
- Konfirmasi momentum: Kombinasi RSI overbuying overselling level ((70/30) dengan MACD Gold Fork Dead Fork, untuk memverifikasi momentum harga
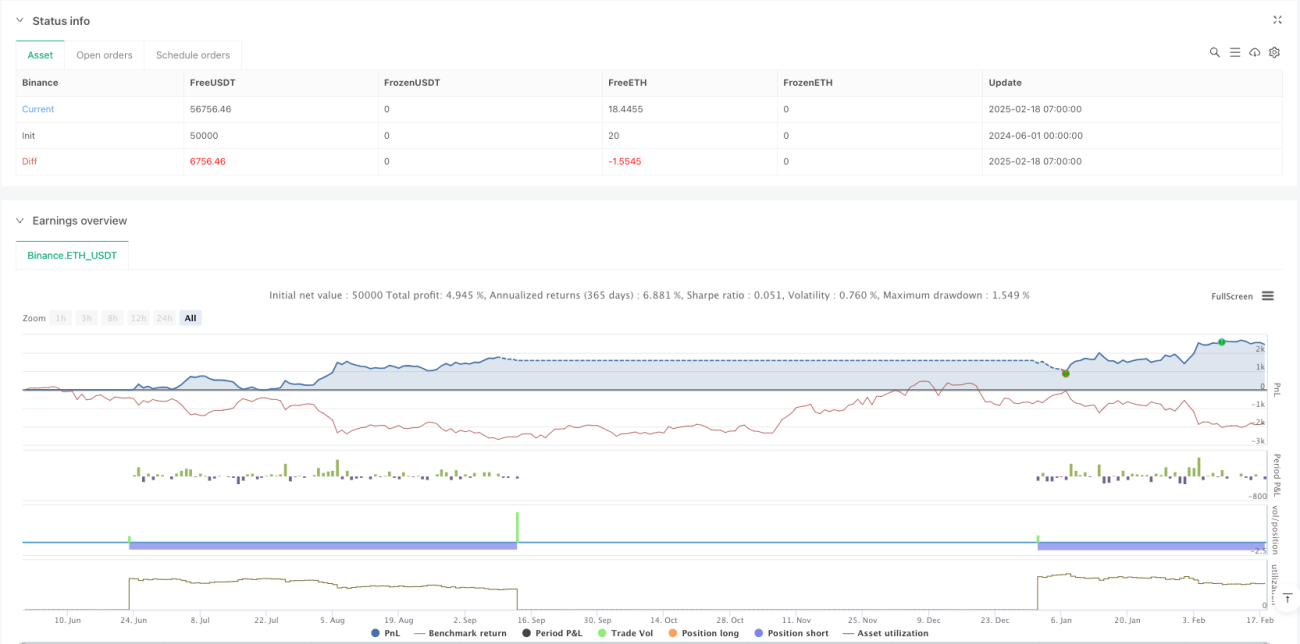
- Pengendalian risiko: mengatur 2% stop loss, 4% stop loss dan 1% tracking stop loss, membangun sistem manajemen risiko yang lengkap
Secara khusus, ketika garis rata-rata cepat ((50 hari) melewati garis rata-rata lambat ((200 hari) membentuk garpu emas, sementara RSI tidak mencapai tingkat overbuy dan MACD membentuk garpu emas, sistem menghasilkan sinyal plus. Sebaliknya, ketika garpu mati muncul dan RSI tidak mencapai tingkat oversell, MACD membentuk garpu mati, sistem menghasilkan sinyal tolak.
Keunggulan Strategis
- Keandalan sinyal tinggi: dengan cross-verifikasi multi-indikator, dapat secara efektif memfilter sinyal palsu
- Trend Capture Accuracy: Menggunakan Sistem Garis Dua Klasik untuk Menangkap Tren Utama dengan Lebih Baik
- Pengendalian risiko yang sempurna: penggunaan komprehensif dari berbagai metode stop loss, pengendalian yang efektif terhadap risiko penurunan
- Adaptif: Parameter strategi dapat disesuaikan dengan kondisi pasar yang berbeda
- Eksekusi yang jelas: kondisi yang jelas untuk menghasilkan sinyal, menghindari gangguan dari penilaian subjektif
Risiko Strategis
- Risiko keterlambatan: Rata-rata pergerakan itu sendiri memiliki keterlambatan, dan Anda mungkin kehilangan waktu masuk terbaik.
- Risiko pasar bergoyang: Dalam pasar bergoyang horizontal, sinyal false breakout mungkin sering terjadi
- Risiko optimasi parameter: parameter yang dioptimalkan secara berlebihan dapat menyebabkan over-fitting yang mempengaruhi stabilitas strategi
- Risiko pengendalian biaya: sering bertransaksi dapat menyebabkan biaya transaksi yang tinggi
- Ketergantungan pada kondisi pasar: strategi bekerja lebih baik di pasar dengan tren yang jelas, tetapi mungkin kurang efektif di lingkungan pasar lainnya
Arah optimasi strategi
- Pengenalan indikator volume transaksi: peningkatan konfirmasi volume transaksi dalam sistem sinyal yang ada, meningkatkan keandalan sinyal
- Adaptasi parameter optimasi: Mengembangkan mekanisme penyesuaian parameter yang dinamis, meningkatkan adaptasi strategi terhadap pasar
- Meningkatkan indikator sentimen pasar: Memperkenalkan indikator sentimen seperti VIX, mengoptimalkan waktu masuk
- Perbaikan mekanisme penghentian kerugian: pengembangan solusi penghentian yang lebih fleksibel, seperti penghentian kerugian dinamis berbasis ATR
- Menambahkan filter volatilitas: menyesuaikan posisi dalam lingkungan volatilitas tinggi, mengoptimalkan rasio risiko-keuntungan
Meringkaskan
Strategi ini dibangun melalui kolaborasi kerjasama dari beberapa indikator teknis, membangun sistem perdagangan yang relatif lengkap. Strategi ini bekerja dengan baik di pasar dengan tren yang jelas, tetapi masih perlu untuk melakukan penyesuaian optimasi sesuai dengan kondisi pasar yang sebenarnya.
- 1