
Ringkasan
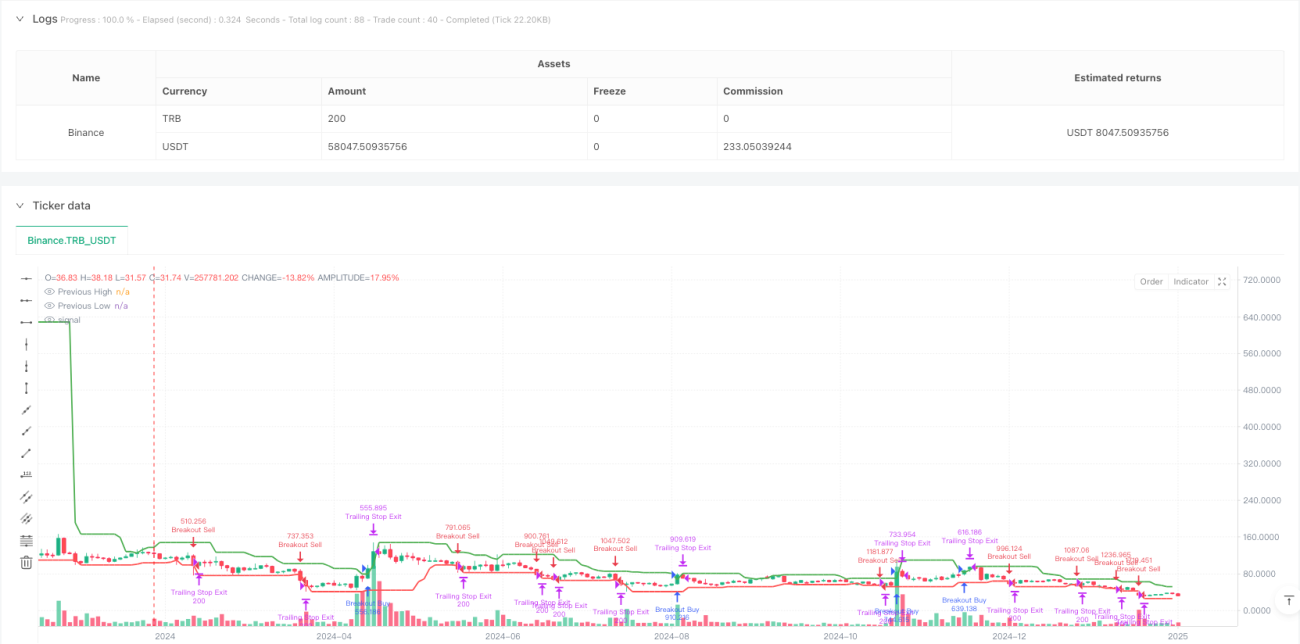
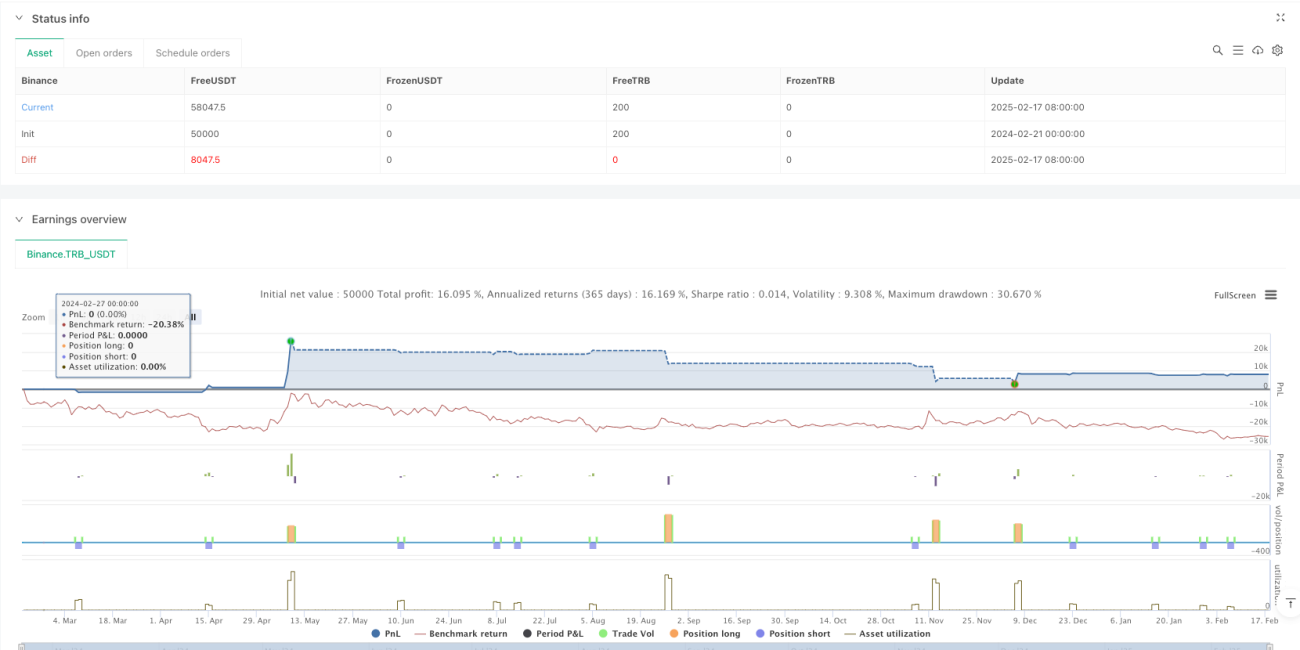
Strategi ini adalah sistem perdagangan yang didasarkan pada harga terobosan dan tracking stop loss secara dinamis. Ini melakukan perdagangan dengan memantau harga tertinggi dan terendah selama N siklus terakhir dan melakukan perdagangan ketika harga menembus tingkat-tingkat penting ini. Strategi ini menggunakan mekanisme stop loss cerdas yang mengaktifkan tracking stop loss hanya setelah mencapai 1% keuntungan, sehingga keuntungan dapat berkembang sepenuhnya.
Prinsip Strategi
Logika inti dari strategi ini mencakup bagian-bagian utama berikut:
- Sinyal masuk: Dengan menghitung harga tertinggi dan terendah dari N siklus terakhir, sinyal perdagangan dipicu ketika harga saat ini menembus tingkat tersebut. Masuk multihead memerlukan persentase tertentu dari harga untuk menembus titik tertinggi sebelumnya, dan kosong untuk menembus titik terendah sebelumnya.
- Manajemen perdagangan: menerapkan periode pendinginan perdagangan 1 jam untuk menghindari perdagangan yang sering terjadi pada saat volatilitas tinggi.
- Pengendalian risiko: Menggunakan stop loss pelacakan dinamis, yang diaktifkan hanya setelah mendapatkan 1% dari keuntungan, dapat lebih melindungi keuntungan.
- Optimasi parameter: parameter utama seperti siklus review, breakthrough, dan stop loss dapat disesuaikan dengan kondisi pasar yang berbeda.
Keunggulan Strategis
- Manajemen risiko yang dinamis: Dengan melacak mekanisme stop loss, strategi dapat membuat keuntungan terus tumbuh sambil melindungi keuntungan.
- Fleksibilitas: Strategi dapat beradaptasi dengan kondisi pasar yang berbeda untuk mengoptimalkan kinerja dengan menyesuaikan parameter.
- Mekanisme penyaringan: Menggunakan periode pendinginan transaksi untuk menghindari overtrading dan meningkatkan kualitas transaksi.
- Sederhana dan efektif: Strategi logis jelas, mudah dipahami dan dilaksanakan, dengan skalabilitas yang baik.
Risiko Strategis
- Risiko terobosan palsu: Pasar dapat mengalami terobosan palsu yang menyebabkan sinyal yang salah. Disarankan untuk meningkatkan konfirmasi transaksi.
- Efek slippage: Pada periode fluktuasi tinggi, mungkin ada slippage yang lebih besar yang mempengaruhi kinerja strategi.
- Sensitivitas parameter: kinerja kebijakan sangat sensitif terhadap pengaturan parameter, yang memerlukan optimasi yang cermat.
- Ketergantungan pada kondisi pasar: mungkin tidak berkinerja baik dalam kondisi volatilitas rendah.
Arah optimasi strategi
- Memperkenalkan indikator volume transaksi: meningkatkan keandalan sinyal terobosan melalui konfirmasi volume transaksi.
- Menambahkan filter tren: Bergabung dengan indikator tren jangka panjang, hanya berdagang di arah tren.
- Penyesuaian parameter dinamis: penyesuaian parameter break-through dan stop loss secara otomatis sesuai dengan fluktuasi pasar.
- Multiple time period: mengintegrasikan sinyal dari beberapa periode waktu untuk meningkatkan akurasi.
Meringkaskan
Ini adalah strategi pelacakan tren yang dirancang dengan baik, yang dikombinasikan dengan terobosan harga dan stop loss dinamis, yang dapat menangkap tren besar dan mengendalikan risiko secara efektif. Strategi ini sangat dapat disesuaikan, dapat disesuaikan dengan lingkungan pasar yang berbeda melalui pengoptimalan parameter.
- 1