Strategi regresi silang RSI multilevel

Ringkasan
Strategi ini adalah sistem perdagangan otomatis yang didasarkan pada indikator yang relatif kuat (RSI) untuk menangkap potensi peluang bouncing, terutama dengan mengidentifikasi kondisi pasar oversold. Strategi ini menggunakan metode posisi progresif, membangun beberapa posisi secara bertahap ketika RSI melewati titik rendah, dan mengendalikan risiko dengan menetapkan target keuntungan.
Prinsip Strategi
Logika inti dari strategi ini didasarkan pada elemen-elemen kunci berikut:
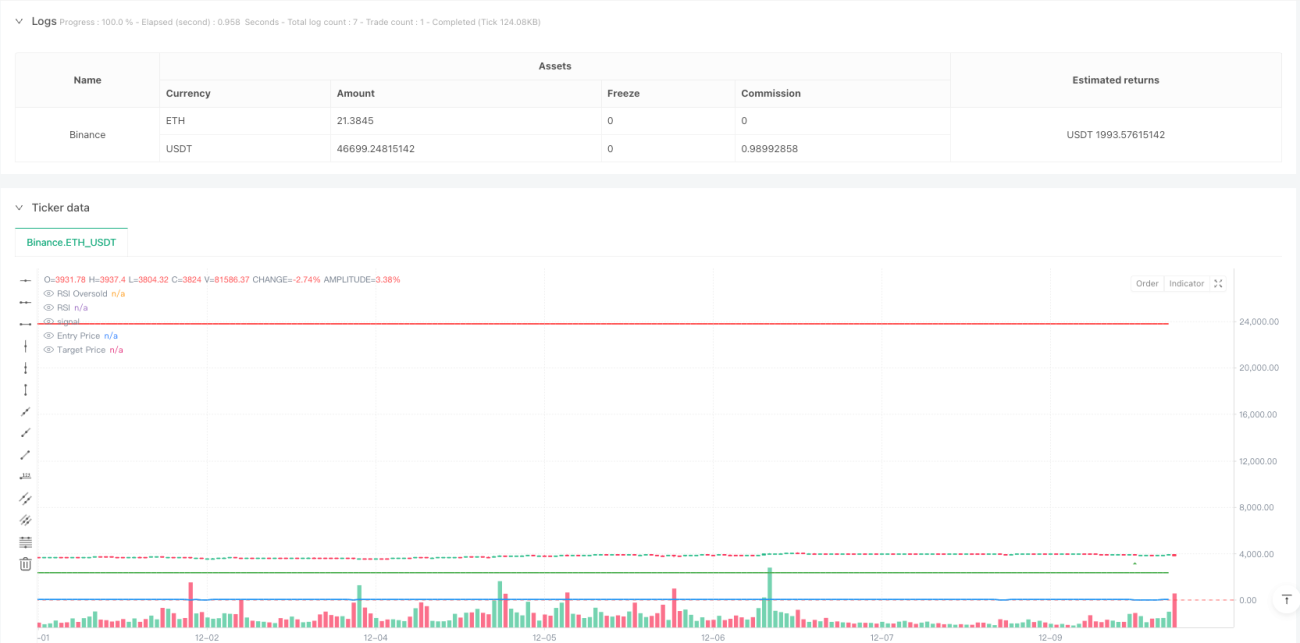
- Sinyal masuk: memicu sinyal beli saat melewati level oversold 28.5 di bawah RSI 14 siklus
- Manajemen Posisi: 6.6% dari ekuitas akun yang digunakan untuk membangun gudang satu kali, dengan maksimal 15 kali pengiriman gudang
- Keuntungan: 50% dari kepemilikan diratakan ketika harga mencapai kenaikan 900% dari harga rata-rata posisi
- Tampilan visual: tanda pada grafik sinyal jual beli, kurva RSI, harga masuk dan harga target
Strategi untuk menilai pergerakan pasar dengan melihat bagaimana indikator RSI berkinerja di area oversold, dan untuk mengurangi biaya penempatan, secara bertahap membuat posisi ketika sinyal oversold muncul.
Keunggulan Strategis
- Sistematisasi posisi: Mengidentifikasi peluang perdagangan secara otomatis melalui parameter RSI yang telah ditetapkan, menghindari bias subjektif yang disebabkan oleh penilaian manusia
- Penyebaran risiko: Menggunakan metode penciptaan posisi berturut-turut, membangun beberapa posisi pada harga yang berbeda, untuk menyebarkan risiko secara efektif
- Fleksibilitas: Parameter strategi dapat disesuaikan dengan kondisi pasar yang berbeda dan preferensi risiko pribadi
- Perlindungan keuntungan: menetapkan target keuntungan yang jelas, secara otomatis mengurangi posisi saat mencapai target, mengunci sebagian keuntungan
- Efisiensi dana: meningkatkan efisiensi penggunaan dana melalui kontrol posisi yang masuk akal dan mekanisme penambahan dana
Risiko Strategis
- Risiko tren: mungkin sering memicu sinyal posisi dalam tren turun yang kuat, menyebabkan kerugian dana
- Parameter sensitif: RSI parameter, rasio posisi yang tidak tepat dan lain-lain dapat mempengaruhi kinerja strategi
- Likuiditas pasar: Di pasar yang kurang likuid, mungkin sulit untuk melakukan transaksi pada harga target
- Manajemen Uang: Hipotesis berlebihan dapat menyebabkan celah risiko yang terlalu besar
Larutan:
- Menambahkan filter tren, menangguhkan posisi dalam tren turun yang jelas
- Pengaturan parameter optimasi dengan pengukuran kembali
- Tetapkan batas maksimum penarikan
- Dinamika penyesuaian marginal
Arah optimasi strategi
- Parameter dinamis: menyesuaikan parameter RSI dan kondisi posisi secara otomatis sesuai dengan fluktuasi pasar
- Mekanisme Stop Loss: Tambahkan fitur Stop Loss Mobile untuk mengendalikan risiko dengan lebih baik
- Market Filter: Menambahkan kondisi filter seperti volume transaksi, tren, dan lain-lain untuk meningkatkan kualitas sinyal
- Optimisasi Keluar: Membuat mekanisme pengurangan keuntungan yang lebih fleksibel, seperti pengurangan saham secara bertahap
- Pengendalian risiko: meningkatkan batas maksimum penarikan dan pengendalian risiko
Meringkaskan
Strategi ini menggunakan indikator RSI untuk mengidentifikasi peluang oversold, menggabungkan kenaikan harga piramida dan rasio tetap untuk menghasilkan keuntungan, dan membangun sistem perdagangan yang lengkap. Keuntungan dari strategi ini adalah operasi yang sistematis dan penyebaran risiko, tetapi perlu memperhatikan pengaruh tren pasar dan pengaturan parameter terhadap kinerja strategi.
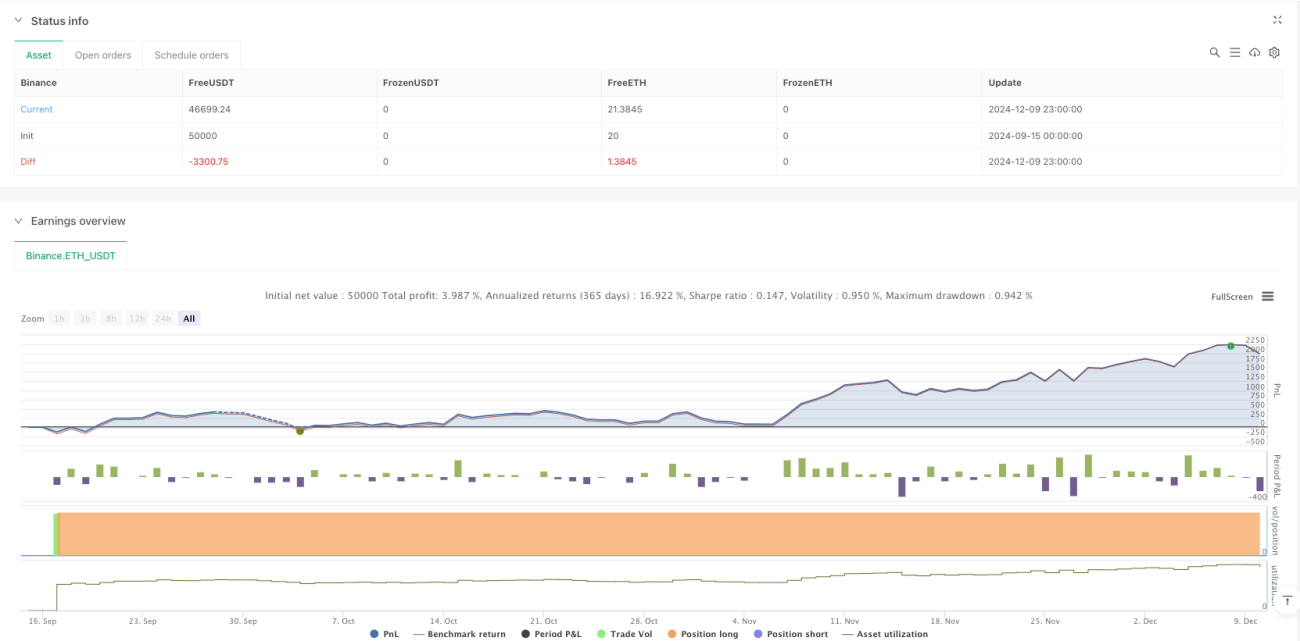
/*backtest
start: 2024-09-15 00:00:00
end: 2024-12-10 00:00:00
period: 1h
basePeriod: 1h
exchanges: [{"eid":"Binance","currency":"ETH_USDT"}]
*/

//@version=5
strategy("RSI Cross Under Strategy", overlay=true, initial_capital=1500, default_qty_type=strategy.percent_of_equity, default_qty_value=6.6)

// Input parameters- 1