Kombinasi multi-indikator ATR trailing stop loss strategi perdagangan cerdas
ATR EMA VWMA SMA JLines Cloud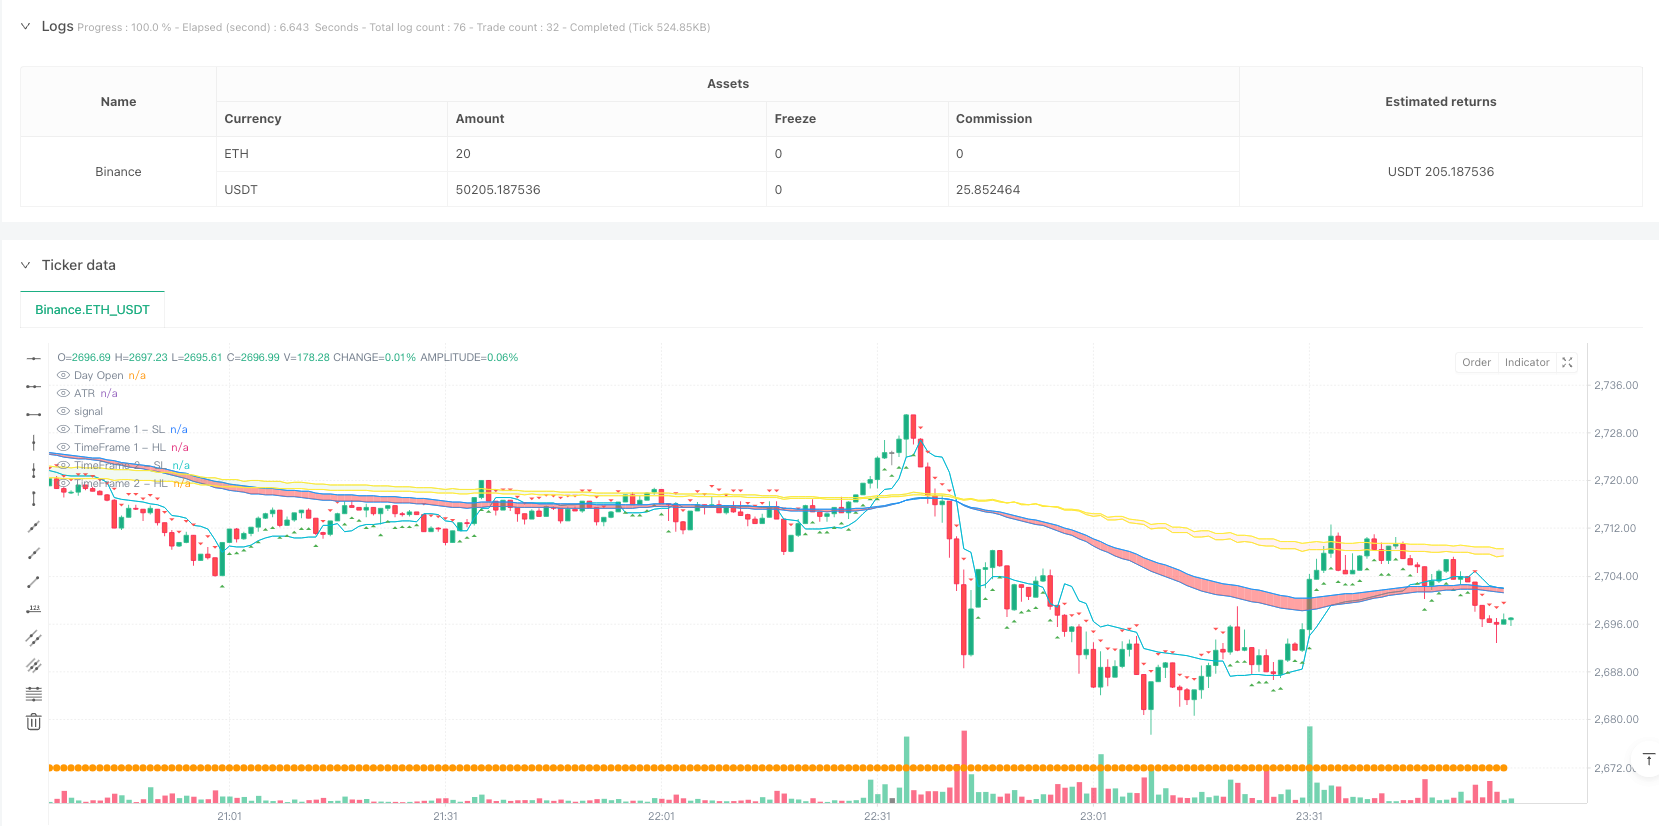
Ringkasan
Ini adalah strategi perdagangan cerdas yang menggabungkan beberapa indikator teknis, terutama berdasarkan indikator ATR untuk pelacakan stop loss. Strategi ini juga mengintegrasikan indikator analisis multi-dimensi seperti JLines Cloud, analisis volume transaksi, dan harga pembukaan dalam sehari, sangat cocok untuk perdagangan dalam jangka waktu 3 menit dan 5 menit. Strategi ini secara dinamis menyesuaikan posisi stop loss melalui ATR, menggabungkan arah penilaian tren dengan sistem linier, untuk mencapai sistem keputusan perdagangan yang komprehensif.
Prinsip Strategi
Inti dari strategi ini adalah sistem tracking stop loss yang dibangun berdasarkan ATR (Average True Rate) indikator. Ini menggunakan 10 siklus ATR dan 2 kali lipat ATR untuk menghitung garis stop loss dinamis. Sistem JLines Cloud yang menggabungkan dua periode waktu (kombinasi garis rata 72⁄89), dan sistem garis rata 5⁄15 yang dapat dipilih.
- ATR melacak terobosan pada garis stop loss
- Tren JLines Cloud dalam dua periode waktu
- Posisi harga terhadap harga bukaan hari
- Konfirmasi volume transaksi yang tidak biasa
Keunggulan Strategis
- Perlindungan Stop Loss Dinamis - menyediakan perlindungan stop loss yang fleksibel untuk beradaptasi dengan fluktuasi pasar melalui indikator ATR
- Pengakuan tren multidimensi - menggunakan kombinasi garis rata-rata dari periode waktu yang berbeda untuk meningkatkan akurasi penilaian tren
- Verifikasi volume transaksi - meningkatkan konfirmasi transaksi melalui analisis volume transaksi yang tidak biasa
- Pengelolaan risiko yang baik - mekanisme perlindungan ganda yang mencakup tujuan stop loss dan profit yang tetap
- Adaptif - dapat menyesuaikan parameter sesuai dengan kondisi pasar yang berbeda
Risiko Strategis
- Sensitivitas parameter - siklus ATR dan pilihan perkalian dapat secara signifikan mempengaruhi kinerja strategi
- Kepercayaan kondisi pasar - kemungkinan munculnya sinyal palsu yang sering terjadi di pasar horizontal
- Pembatasan persyaratan ganda - persyaratan masuk yang ketat dapat menyebabkan kehilangan beberapa peluang perdagangan
- Efek slippage - saat volatilitas tinggi, harga eksekusi sebenarnya mungkin memiliki deviasi yang lebih besar dari harga sinyal
Arah optimasi strategi
- Dynamic Parameter Adjustment - Parameter ATR dapat disesuaikan secara otomatis sesuai dengan volatilitas pasar
- Filter waktu - Tambahkan filter waktu perdagangan untuk menghindari periode fluktuasi tinggi pada buka dan tutup pasar
- Filter intensitas tren - memperkenalkan indikator intensitas tren untuk meningkatkan akurasi penilaian tren
- Optimalisasi manajemen risiko - mencapai stop loss rasio yang dinamis dan beradaptasi dengan kondisi pasar yang berbeda
- Peningkatan Analisis Volume Transaksi - Metode Analisis Volume Transaksi yang Lebih Rinci dan Peningkatan Akurasi Konfirmasi Transaksi
Meringkaskan
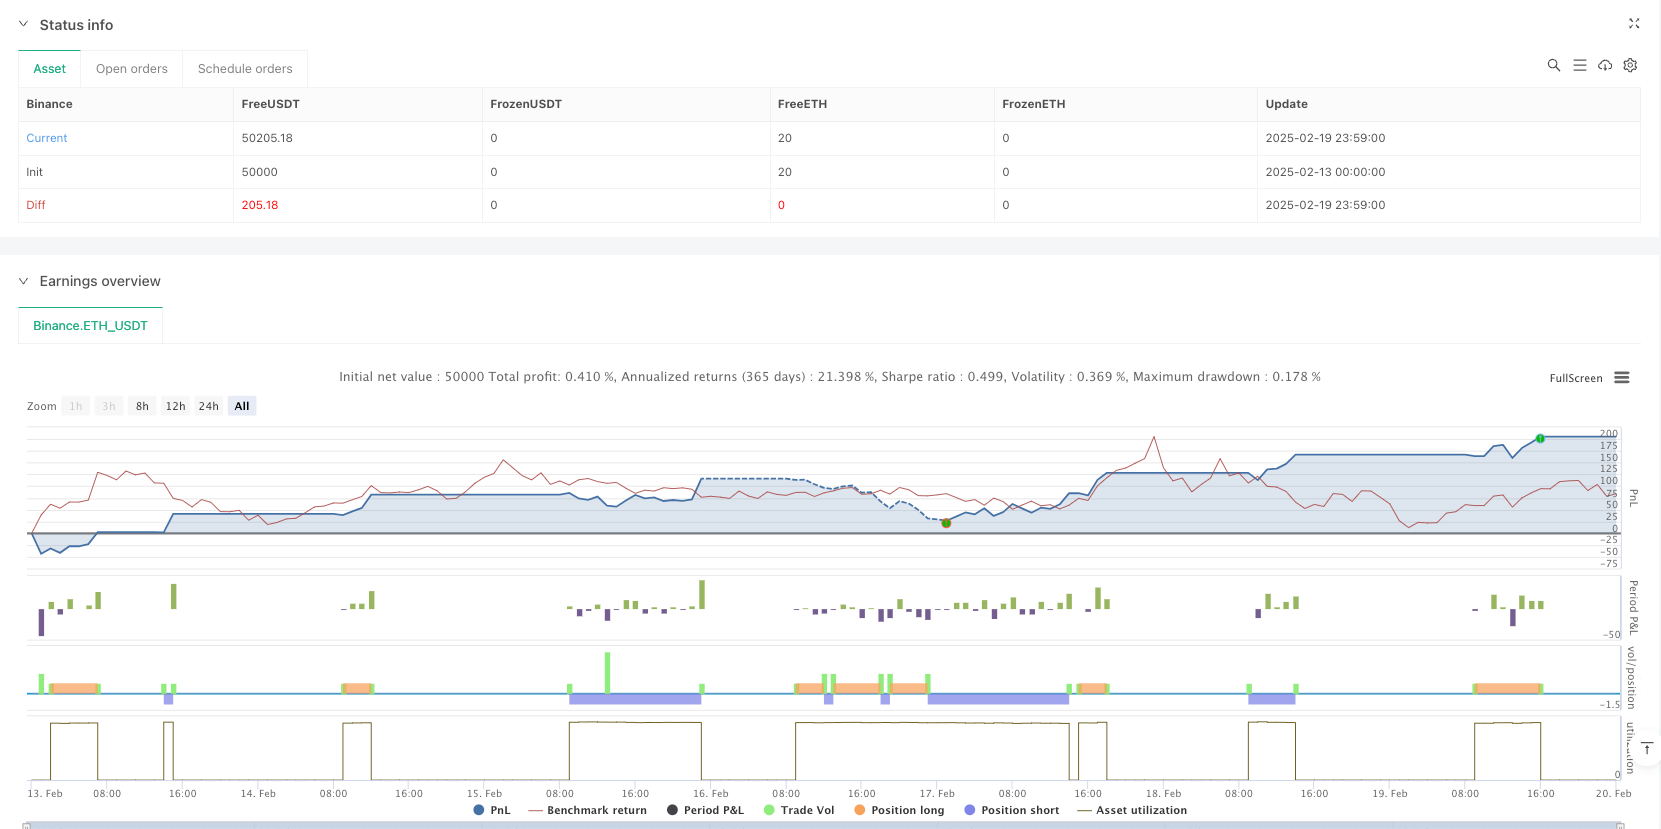
Ini adalah sistem perdagangan lengkap yang menggabungkan beberapa indikator teknis, memberikan manajemen risiko inti melalui ATR Tracking Stop Loss, dan memberikan konfirmasi perdagangan menggunakan awan linear dan analisis volume transaksi. Keunggulan strategi adalah kerangka analisis pasar yang komprehensif dan sistem manajemen risiko yang baik, tetapi perlu mengoptimalkan parameter untuk lingkungan pasar tertentu.
/*backtest
start: 2025-02-13 00:00:00
end: 2025-02-20 00:00:00
period: 1m
basePeriod: 1m
exchanges: [{"eid":"Binance","currency":"ETH_USDT"}]
*/

//@version=6
strategy("AI trade Roney nifty value", overlay=true)

// User Inputs
atrPeriod = input.int(10, "ATR Period")
atrMultiplier = input.float(2, "ATR Multiplier")
target = input.float(40, "Target")
stopLoss = input.float(40, "Stop Loss")

// Calculate ATR-based trailing stop
atr = ta.atr(atrPeriod)
nLoss = atrMultiplier * atr
var float xATRTrailingStop = na

if na(xATRTrailingStop)
    xATRTrailingStop := close - nLoss
else
    if close > xATRTrailingStop[1] and close[1] > xATRTrailingStop[1]
        xATRTrailingStop := math.max(xATRTrailingStop[1], close - nLoss)
    else if close < xATRTrailingStop[1] and close[1] < xATRTrailingStop[1]
        xATRTrailingStop := math.min(xATRTrailingStop[1], close + nLoss)
    else
        xATRTrailingStop := close > xATRTrailingStop[1] ? close - nLoss : close + nLoss

// Define position and entry/exit prices
var int pos = na
pos := close[1] < xATRTrailingStop[1] and close > xATRTrailingStop[1] ? 1 :
       close[1] > xATRTrailingStop[1] and close < xATRTrailingStop[1] ? -1 : pos[1]

var bool isLong = false
var bool isShort = false

var float entryPrice = na
var float exitPrice = na
var float exitStop = na

// JLines Cloud indicator
sl = input.int(72, "Smaller length")
hl = input.int(89, "Higher length")

res = input.timeframe("1", "JLines - Time Frame 1")
res1 = input.timeframe("3", "JLines - Time Frame 2")
enable515 = input.bool(false, "5/15 EMA")
res2 = input.timeframe("5", "5/15 EMA")

ema1_72 = request.security(syminfo.tickerid, res, ta.ema(close, sl))
ema1_89 = request.security(syminfo.tickerid, res, ta.ema(close, hl))
ema2_72 = request.security(syminfo.tickerid, res1, ta.ema(close, sl))
ema2_89 = request.security(syminfo.tickerid, res1, ta.ema(close, hl))
ema3_5 = request.security(syminfo.tickerid, res2, ta.ema(close, 5))
ema3_15 = request.security(syminfo.tickerid, res2, ta.ema(close, 15))

// Plot JLines Cloud
p1_1 = plot(ema1_72, "TimeFrame 1 - SL", color=color.blue, display=display.none)
p1_2 = plot(ema1_89, "TimeFrame 1 - HL", color=color.blue, display=display.none)
p2_1 = plot(ema2_72, "TimeFrame 2 - SL", color=color.yellow, display=display.none)
p2_2 = plot(ema2_89, "TimeFrame 2 - HL", color=color.yellow, display=display.none)
p3_1 = plot(enable515 ? ema3_5 : na, "Late Day Fade - 5 EMA", color=color.yellow, display=display.none)
p3_2 = plot(enable515 ? ema3_15 : na, "Late Day Fade - 15 EMA", color=color.yellow, display=display.none)

fill(p1_1, p1_2, color=ema1_72 > ema1_89 ? color.new(color.green, 30) : color.new(color.red, 30), title="Background 1")
fill(p2_1, p2_2, color=ema2_72 > ema2_89 ? color.new(color.green, 90) : color.new(color.red, 90), title="Background 2")
fill(p3_1, p3_2, color=enable515 ? (ema3_5 > ema3_15 ? color.new(color.blue, 50) : color.new(color.red, 50)) : na, title="Late Day Fade")

// Plot Buy and Sell signals
plotshape(pos == 1, title="Buy", style=shape.triangleup, location=location.belowbar, color=color.green)
plotshape(pos == -1, title="Sell", style=shape.triangledown, location=location.abovebar, color=color.red)

// Volume Analysis
vol_length = input.int(20, "Volume SMA length", minval=1)
vol_avg = ta.sma(volume, vol_length)

unusual_vol_down = volume > vol_avg * 1.2 and close < open
unusual_vol_up = volume > vol_avg * 1.2 and close > open

barcolor(unusual_vol_down or unusual_vol_up ? color.yellow : na)

// ATR Indicator
len2 = input.int(20, minval=1, title="Smooth")
src = input.source(close, title="Source")
out = ta.vwma(src, len2)
avg1 = math.avg(out, xATRTrailingStop) // FIXED: Replaced `ta.avg()` with `math.avg()`

plot(avg1, color=color.aqua, title="ATR")

// Daily Open Line
dl = input.bool(true, "Show daily Open")
dopen = request.security(syminfo.tickerid, "D", open)
plot(dl ? dopen : na, title="Day Open", color=color.orange, style=plot.style_circles, linewidth=2)

// Strategy Entry Conditions
if pos == 1 and not isLong and ema1_72 > ema1_89 and ema2_72 > ema2_89 and ema1_72 > ema2_72 and close > dopen
    entryPrice := close
    exitPrice := close + target
    exitStop := entryPrice - stopLoss
    strategy.entry("Buy", strategy.long)
    strategy.exit("buy_target", "Buy", limit=exitPrice)
    isLong := true
    isShort := false

if pos == -1 and not isShort and ema1_72 < ema1_89 and ema2_72 < ema2_89 and ema1_72 < ema2_72 and close < dopen
    entryPrice := close
    exitPrice := close - target
    exitStop := entryPrice + stopLoss
    strategy.entry("Sell", strategy.short)
    strategy.exit("Sell_target", "Sell", limit=exitPrice)
    isLong := false
    isShort := true

// Stop Loss Handling
if strategy.position_size > 0 and close < entryPrice - stopLoss
    strategy.close("Buy", comment="Buy_Stop Loss")

if strategy.position_size < 0 and close > entryPrice + stopLoss
    strategy.close("Sell", comment="Sell_Stop Loss")