
Ringkasan
Strategi ini adalah sistem perdagangan inovatif yang didasarkan pada kesenjangan nilai wajar (FVG) untuk menangkap peluang perdagangan potensial dengan mengidentifikasi kesenjangan harga dan abnormalitas volume transaksi di pasar. Strategi ini menggabungkan mekanisme penghitungan dinamis dan pemrosesan standar, tidak hanya dapat mengidentifikasi sinyal jual beli dengan akurat, tetapi juga dapat membantu pedagang memahami struktur pasar dengan lebih baik melalui tampilan visual.
Prinsip Strategi
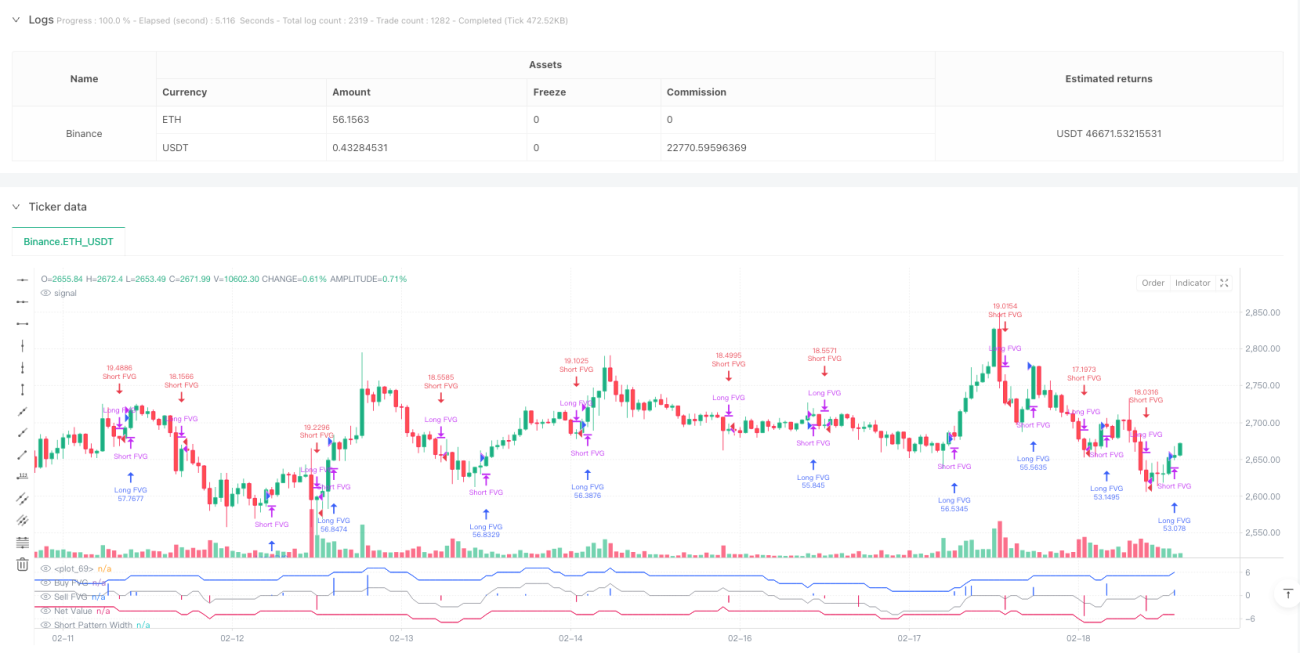
Inti dari strategi ini adalah untuk mengidentifikasi peluang perdagangan potensial dengan memantau kesenjangan harga antara garis K yang berurutan. Secara khusus:
- Kondisi pembentukan BFVG adalah bahwa harga terendah pada garis K saat ini lebih tinggi dari harga tertinggi sebelum dua garis K
- Kondisi pembentukan FVG (SFVG) adalah bahwa harga tertinggi dari garis K saat ini lebih rendah dari harga minimum sebelum dua garis K
- Strategi ini memperkenalkan mekanisme verifikasi berdasarkan volume transaksi dan ukuran celah, dan hanya FVG yang memenuhi persyaratan verifikasi yang akan memicu sinyal transaksi
- Menggunakan jendela penghitungan dinamis dengan 50 siklus untuk mengakumulasi jumlah FVG di luar angkasa
- Menerjemahkan lebar gap ke nilai indikator yang lebih intuitif dengan pengolahan homogenisasi
Keunggulan Strategis
- Sistem ini memiliki mekanisme verifikasi sinyal yang baik, meningkatkan kualitas sinyal dengan konfirmasi ganda volume transaksi dan lebar celah
- Jendela penghitungan dinamis efektif menangkap perubahan tren pasar
- Pengolahan homogenisasi membuat sinyal dari periode yang berbeda dapat dibandingkan
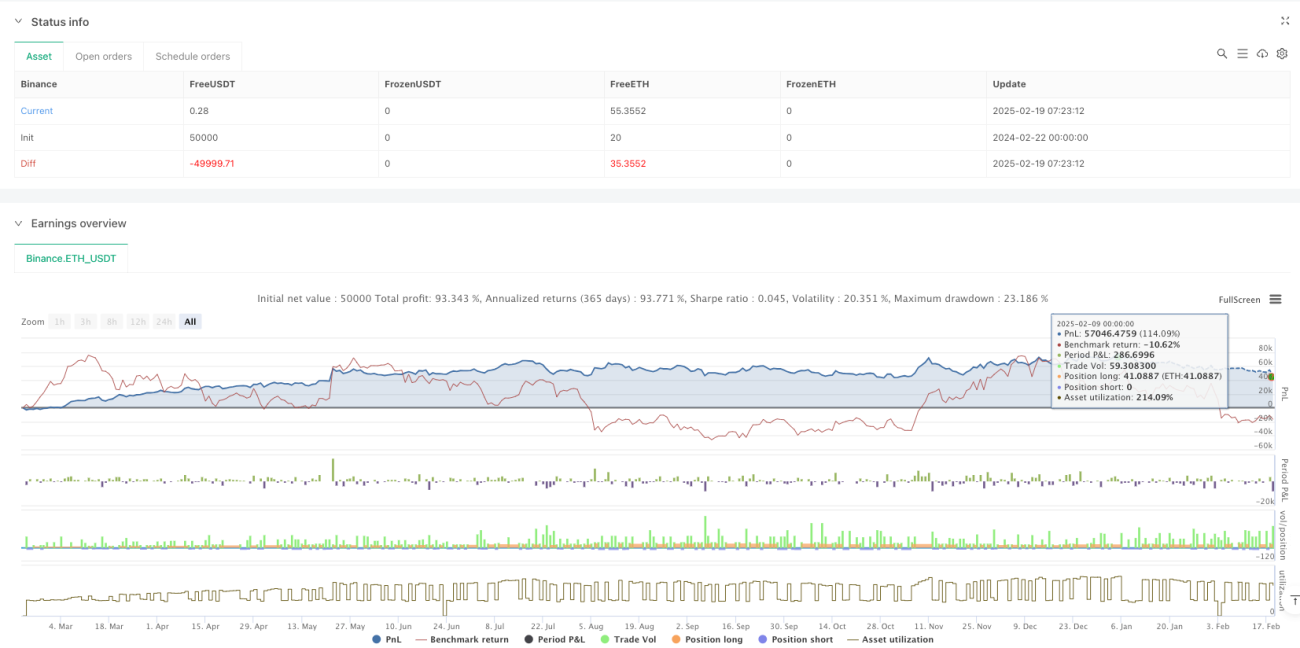
- Strategi memiliki fungsi manajemen posisi otomatis, yang secara otomatis melunasi posisi reverse hold sebelum membuka posisi baru
- Efek visualisasi yang bagus untuk membantu trader memahami kondisi pasar
Risiko Strategis
- Sinyal FVG dapat menghasilkan sinyal palsu di pasar yang bergejolak
- Parameter verifikasi tetap mungkin tidak berlaku untuk semua lingkungan pasar
- Tidak ada pengaturan stop loss dan stop braking yang dapat menyebabkan penarikan yang lebih besar.
- Transaksi yang lebih sering dapat menyebabkan biaya transaksi yang lebih tinggi
Disarankan untuk mengelola risiko ini dengan mengatur posisi stop loss yang tepat dan memperkenalkan filter lingkungan pasar.
Arah optimasi strategi
- Memperkenalkan mekanisme penyesuaian parameter yang dapat disesuaikan sehingga strategi dapat beradaptasi dengan lebih baik dengan berbagai kondisi pasar
- Menambahkan filter tren, hanya melakukan perdagangan satu arah dalam tren yang kuat
- Desain sistem manajemen gudang yang lebih kompleks, termasuk batch build dan stop loss dinamis
- Mempertimbangkan biaya transaksi dan mengoptimalkan frekuensi transaksi
- Meningkatkan reliabilitas sinyal, dikombinasikan dengan indikator teknis lainnya
Meringkaskan
Ini adalah strategi perdagangan inovatif yang didasarkan pada struktur harga untuk menangkap peluang pasar dengan identifikasi dan verifikasi cerdas terhadap kesenjangan nilai wajar. Strategi ini dirancang dengan konsep yang jelas, cara implementasinya profesional, dan memiliki skalabilitas yang baik. Dengan arah optimasi yang disarankan, stabilitas dan profitabilitas strategi diharapkan dapat ditingkatkan lebih lanjut.
/*backtest
start: 2024-02-22 00:00:00
end: 2025-02-19 08:00:00
period: 1h
basePeriod: 1h
exchanges: [{"eid":"Binance","currency":"ETH_USDT"}]
*/

// ----------------------------------------------------------------------------
// This Pine Script™ code is subject to the terms of the Mozilla Public License
// 2.0 at https://mozilla.org/MPL/2.0/
// © OmegaTools- 1