Strategi Perdagangan Tren Adaptif Multi-Indikator

Ringkasan
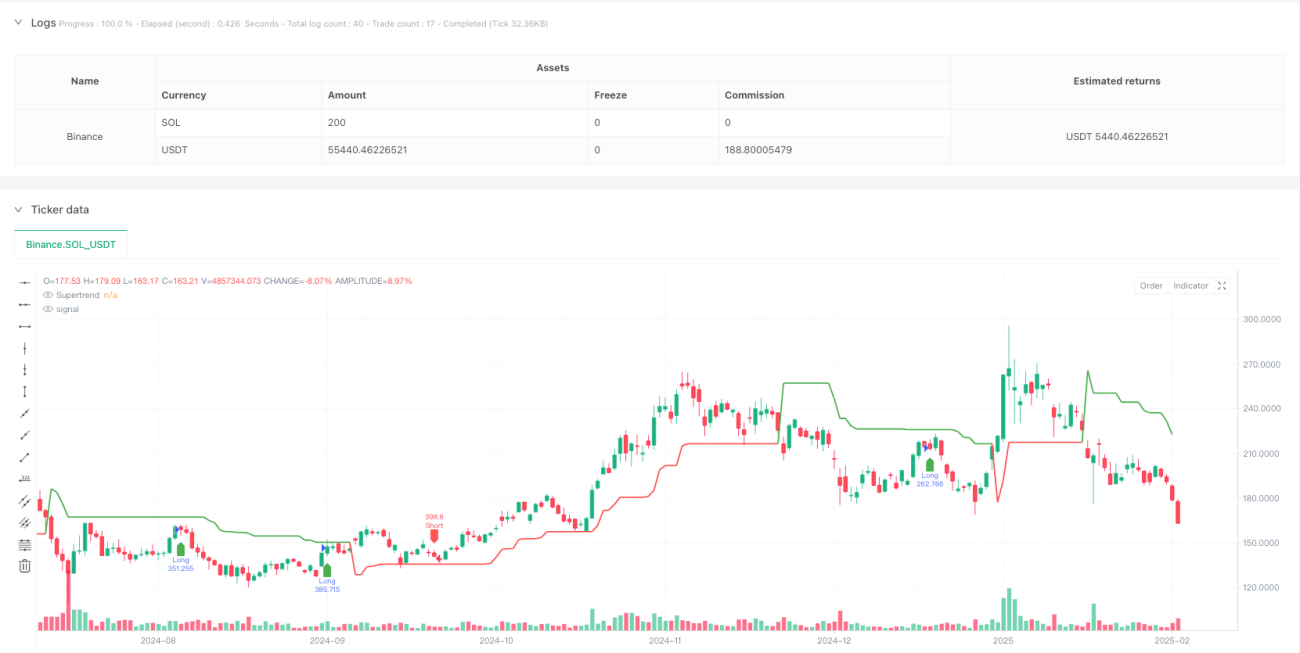
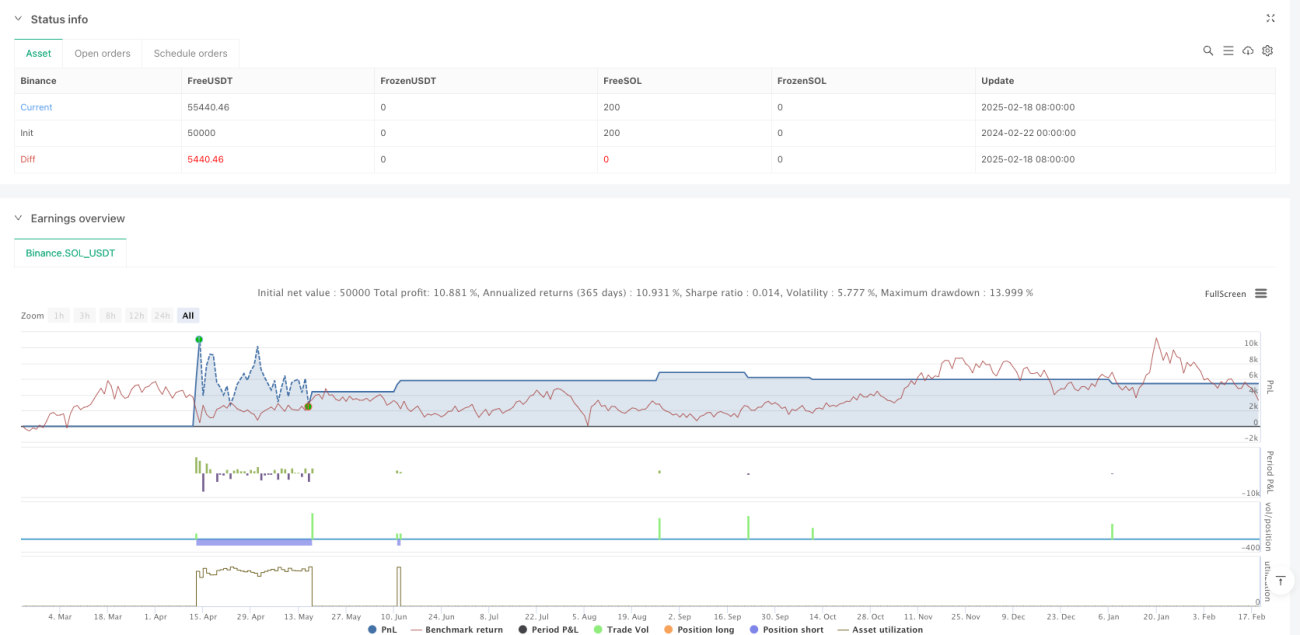
Strategi ini adalah sistem perdagangan tren adaptif yang menggabungkan beberapa indikator teknis. Strategi ini menggabungkan sistem rata-rata bergerak (EMA), indikator momentum (RSI), indikator tren (MACD), dan SuperTrend untuk konfirmasi sinyal, serta dilengkapi dengan mekanisme manajemen risiko yang lengkap, termasuk stop loss, take profit, dan trailing stop. Desain strategi ini mempertimbangkan volatilitas pasar secara penuh, meningkatkan stabilitas dan keandalan perdagangan melalui penyaringan sinyal ganda dan pengendalian risiko.
Prinsip Strategi
Strategi ini menggunakan mekanisme konfirmasi sinyal bertingkat:
- Menentukan arah tren awal melalui persilangan EMA periode 9 dan 21
- Menggunakan RSI (14) untuk penyaringan overbought/oversold, sinyal beli memerlukan RSI > 40 dan < 70, sinyal jual memerlukan RSI < 60 dan > 30
- Indikator MACD memverifikasi momentum tren, memerlukan arah garis sinyal dan garis MACD yang sejalan
- Indikator SuperTrend memberikan konfirmasi tren tambahan
- Pengendalian risiko menggunakan stop loss 5%, take profit 10%, trailing stop 2%, dan titik impas 1%
Sinyal perdagangan hanya akan dipicu ketika semua kondisi terpenuhi secara bersamaan, secara efektif mengurangi risiko dari breakout palsu.
Keunggulan Strategi
- Mekanisme konfirmasi sinyal ganda secara signifikan mengurangi gangguan sinyal palsu
- Sistem pengendalian risiko yang lengkap, mencakup stop loss tetap, trailing stop, dan stop loss impas
- Strategi ini memiliki kemampuan adaptasi yang baik, dapat beradaptasi dengan berbagai lingkungan pasar
- Logika masuk dan keluar jelas, mudah dipahami dan dipelihara
- Logika perdagangan memiliki dasar teori yang baik, setiap indikator memiliki fungsi spesifiknya
Risiko Strategi
- Mekanisme konfirmasi sinyal ganda dapat menyebabkan melewatkan beberapa peluang perdagangan penting
- Di pasar yang sangat fluktuatif, level stop loss tetap mungkin tidak cukup fleksibel
- Optimasi parameter dapat menyebabkan overfitting terhadap data historis
- Beberapa indikator dapat menghasilkan sinyal yang membingungkan di pasar sideways
Solusi meliputi: penyesuaian parameter stop loss secara dinamis, pengenalan indikator volatilitas, optimasi parameter ulang secara berkala, dll.
Arah Optimasi Strategi
- Memperkenalkan mekanisme parameter adaptif, menyesuaikan parameter secara dinamis berdasarkan volatilitas pasar
- Menambahkan indikator volume sebagai alat konfirmasi tambahan
- Mengoptimalkan mekanisme stop loss, memperkenalkan stop loss dinamis berbasis ATR
- Menambahkan modul identifikasi lingkungan pasar, menggunakan kombinasi parameter yang berbeda di berbagai kondisi pasar
- Mengembangkan sistem optimasi parameter berbasis machine learning
Kesimpulan
Strategi ini membangun sistem perdagangan yang kokoh melalui koordinasi indikator teknis multi-dimensi. Mekanisme pengendalian risiko yang lengkap dan logika perdagangan yang jelas membuatnya memiliki kepraktisan yang baik. Meskipun masih ada ruang untuk optimasi, kerangka dasar strategi ini memiliki dasar teori yang kuat. Melalui optimasi dan perbaikan berkelanjutan, diharapkan dapat lebih meningkatkan efektivitas perdagangannya.
/*backtest
start: 2024-02-22 00:00:00
end: 2025-02-19 08:00:00
period: 1d
basePeriod: 1d
exchanges: [{"eid":"Binance","currency":"SOL_USDT"}]
*/

//@version=5
strategy("Optimized BTC Trading Strategy v2", overlay=true, default_qty_type=strategy.percent_of_equity, default_qty_value=100, commission_type=strategy.commission.percent, commission_value=0.1)

// Input parameters- 1